Research Article | | Peer-Reviewed

Assessing the Performance of Conveyance System of Jato Small-Scale Irrigation Scheme of Wayu-Tuka District, East Wallaga Zone, Oromia, Ethiopa

Received: 11 March 2024    Accepted: 29 March 2024    Published: 29 April 2024
Views:       Downloads:
Abstract

The performance assessment of a small-scale irrigation project plays a vital role in evaluating its effectiveness and addressing potential shortcomings in achieving desired outcomes. This study aims to provide a comprehensive analysis of the Jato small-scale irrigation project, assessing its performance based on various criteria and indicators. The study evaluates the project's infrastructure maintenance and system efficiency. The designed command area of the scheme is seventy-five (75 ha) but the current irrigated area of the scheme is sixty (60ha) only. To achieve the objectives, primary and secondary data were collected. To gather both primary and secondary data, data-gathering techniques include surveys, interviews, field observations, and meteorological data. Before, during, and after an irrigation event, while farmers were carrying out their regular irrigation practices, several field characteristics were measured and/or observed. These data included the type of crop, irrigation water discharge in the canal, and field size. A survey concerning the availability of water was also carried out among farmers. CROPWAT 8.0 Software was used to organize the crop pattern of the study area along with other relevant data, including soil, climate, rain crop, and crop pattern. Water flow measurement results of the Jato small-scale irrigation scheme at the head, middle, and tail of the lined & unlined main canal were found to be 53.6l/s, 45.4 l/s, and 29.9l/s respectively. The average water flow measurement result of the scheme is 43l/s which reduced from required flow by 18.15l/s. From the analyses of the water balance indicators, the canal conveyance efficiency, canal conveyance loss, application efficiency, and overall efficiency were found to be 70%, 30%, 70%, and 50% respectively. The overall average main canal conveyance efficiency and water conveyance loss were below the recommended values. The studies have shown that the effective infrastructure, irrigation ratio, and water surface elevation ratio of the scheme were found to be 66.7%, 80%, and 66% respectively. However, there were certain areas for improvement identified, such as the need for better coordination among project stakeholders and enhanced maintenance practices to ensure the long-term functionality of irrigation infrastructure.

Published in American Journal of Civil Engineering (Volume 12, Issue 2)
DOI 10.11648/j.ajce.20241202.11
Page(s) 48-65
Creative Commons

This is an Open Access article, distributed under the terms of the Creative Commons Attribution 4.0 International License (http://creativecommons.org/licenses/by/4.0/), which permits unrestricted use, distribution and reproduction in any medium or format, provided the original work is properly cited.

Copyright

Copyright © The Author(s), 2024. Published by Science Publishing Group

Keywords

Conveyance Efficiency, Conveyance Loss, Crop water requirement, Irrigation Systems, Jato SSI Scheme,Maintenance Indicators

1. Introduction
Water consumption rises everywhere by the global population. Agriculture is the sector that uses the most water worldwide. Irrigation plays a principal position in sustainable improvement and poverty reduction [1, 2]. Irrigation water can be received from a river or pumped [3].
Ethiopia is endowed with a substantial amount of water sources that receive about 980 billion cubic meters of rainwater per year [4]. One manner to reinforce agricultural output and fulfill Ethiopia's expanding need is through irrigation [5].
In Ethiopia, irrigation is seen as a fundamental technique for reducing poverty, reaching food security, and improving the economics of the farming network by producing additional cash during the dry season. Ethiopia has a total potential arable land of approximately 74 million hectares [6]. The total agricultural land area in Ethiopia was approximately 74.3 million hectares; out of which only 2.7 million hectares were irrigated [7]. However, to achieve this lofty goal, Ethiopia must overcome the following four significant institutional, socioeconomic, technical, and environmental challenges [7].
The poor performance of the current irrigation systems is one of the obstacles to the growth of irrigation [8]. Underperformance affects all scheme sizes (small, medium, and large) throughout Ethiopia [9]. This study examined the operation of irrigated systems in the Jato irrigation project with the overall goal of evaluating system performance and suggesting workable solutions for enhancing planning and implementation performance, which will in turn improve the performance of small-scale irrigation schemes managed by the community.
2. Materials and Methods

2.1. Location and Description of the Study Area

The Jato small-scale irrigation scheme is situated in the Boneya Molo peasant association's East Wallaga Zone Wayu Tuka District of Oromia Regional State. The project's command area is about 10.1 km away from the woreda capital, Gute town. The command area of the project is estimated to be about 60 ha and is planned to be irrigated through diversion from the River. The scheme head work is located at 80 52’30’’N - 80 59’30’’N, Easting 360 42’30’’E -360 56’30’’E, and an altitude of 1724m.a.s.l.
In the Oromia National Regional State's East Wallaga Zone, the Wayu Tuka District is situated roughly 322 kilometers to the west of Addis Ababa. The road from the site to Gute town is a weather road and from Nekemte town to Gute town Asphalt road is 12 km.
The boundaries of Wayu Tuka District are Wamahagalo in the north, Sibu Sire in the east, Leka Dulacha in the south, and Guto Gida in the west. The Woreda consists of 12 Kebeles, 10 rural, and 2 urban centers, covering a total area of 28,952.795 Ha. The district has an estimated 40,427 hectares of rural land covered by different crops and natural forests. Stream Jato flows from north to south, spanning the main Addis Ababa asphalt road to Nekemte.
The Jato irrigation project was established by the regional government. The project was constructed in 1994 E.C. for the 75 ha of command area but the current irrigated area was 60 ha which gives a direct benefit for 157 householders directly.
The project has served for 14 (fourteen) years without any major maintenance and rehabilitation even though minor maintenance has taken place at the farmer's level which actively participated in both the maintenance and operation phases. This scheme's main canal is 2.535 kilometers long, with some parts of the canal unlined. Both lined and unlined canal systems exist. Water was intended to be transported to the field by a lined canal with a 0.4 m width and 0.5 m depth. The design discharge inflow to the main canal is 52.15l/s. The soil of the study area is medium (loam). The location of this study area is shown in Figure 1.
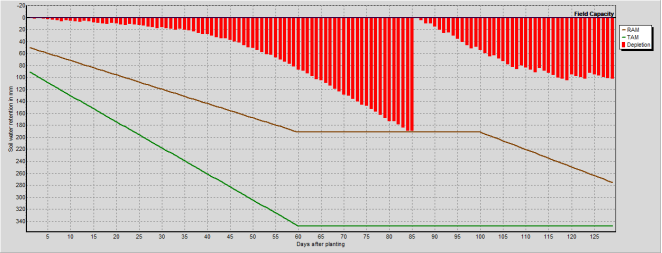
Figure 1. Location map of the study area.

2.2. Materials and Tools Used in the Study

2.2.1. Materials

1) Digital camera
2) Measuring tape
3) GPS
4) Stopwatch

2.2.2. Tools

1) ArcGIS10.8
2) CROPWAT8.0 Software
3) Microsoft Excel (spreadsheet)

2.3. Diversion Headwork Structures

The weir structure was constructed with financial support from the regional government and became functional in 1994. The designed and actual command areas in irrigation were 75 and 60 ha respectively. It was intended to serve around 157 households found in Boneya Molo Kebele. The conveyance system of the irrigation scheme consists of a Main canal (MC) taking water from the corresponding intake of the weir [10–12]. The main canal starts from the water abstraction site on the side of the weir and conveys water for a length of 2535 m of the main canal, for the first 2500 m it is a lined canal and for the rest, it is an unlined canal. So for evaluating the conveyance efficiency of the main canal flow measurements were taken on 3 sections of the canal (head, middle, & tail of canal). A type of weir is a Broad crested masonry weir. The Length or span of the weir overflow was taken 20m from the existing situation of the river section.
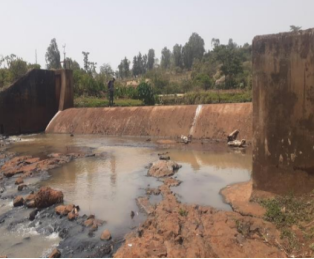
Figure 2. Jato SSIP weir view from the downstream.

2.4. Cropping Pattern

Different annual crops are produced by beneficiaries around the project area. The major ones are; Pepper, Potato, Tomato, Wheat, etc. Almost all cereal crops in the area are produced by rain-fed agriculture and small parts of vegetables are produced by wetlands and traditional irrigation.
Table 1. Crop-type area coverage.

S.No.

Crop type

Coverage (ha)

% of coverage

1

Potato

21

35

2

Tomato

9

15

3

Pepper

7.2

12

4

Wheat

22.8

38

Total

60

100

The yield potential of these annual crops is a function of environmental conditions, such as the availability and prevalence of rain. All cereal crops are produced by local seeds and the yield per hectare gained is low. Because, of the shortage of availability of improved varieties of seeds and inputs.
Figure 3. Wheat crop grow in the command area.

2.5. Method of Data Collection

2.5.1. Primary Data Collection

(i). Frequent Field Observations

It was conducted to observe and investigate the method of water applications, and practices related to water management techniques, the water delivery structures status, and channels status in the whole scheme. Every structure constructed in the scheme was visited and its status was to see the number of ones that are functioning adequately and the ones that are not functioning adequately.

(ii). Measurements of Water Flow at the Main Canal

Using the floating method, the Jato irrigation canal flow was measured. At specified points, the main canal discharges were measured. Based on this average discharge coupled with the total flow time, the total volume of water diverted by the irrigation scheme was estimated. The calculation of discharge using the floating method involves the following steps:
1. Measure the distance between two known points along the canal or channel
2. Place the float at the starting point and start a stopwatch.
3. Record the time it takes for the float to reach the ending point
4. Calculate the velocity by dividing the measured distance by the recorded time
5. Lastly, determine the discharge by multiplying the velocity by the pipe or channel's cross-sectional area. Measurements can be made at the same location by dividing the cross-section into three sections at the middle, left, and right ends of the canal. The average depth can be calculated by dividing the total number of measurements by the total number of measured depths.
Dave = d1+d2+d3 3  (1)
Where: Dave- average water depth (m),
d1- left end water depth (m),
d2- mid-water depth (m), and
d3- right end water depth (m)
The main canal in the study area is a 0.4 m wide rectangular lined canal. The average width and average depth of the canal have been multiplied to determine the cross-sectional area. It was advised that this be done by first adding up all of the partitions that had been separated into depth measurements at specific intervals and then multiplying the result by the average depth.
A= Dave*Wave (2)
Where: Wave: the canal's average width (m), and Dave: average depth (m) is given.
The flow velocity was assessed by choosing a section of the canal that was 15 meters long the canal and straight, placing two stakes, positioning a floating object on the center line of the canal at least 5 meters upstream of point 1, starting the stopwatch when the object reaches point 1, recording the time the floating materials take to reach point 2, and repeating the previous steps three times to calculate the average.
tave= t1+t2+t3 3  (3)
Where t1, t2, and t3, respectively, are the first, second, and third trials time taken for the floating object to travel a known distance (seconds), and tave is the average time. This is how the surface velocity was determined:
Vsur = Dt Tt  (4)
Where Dt is distance travel in meters, Tt is time travel, and Vsur is the channel's surface velocity in (m/s).
The mean velocity is calculated using a correction factor from the surface velocity measured by this method.
To determine the mean velocity of flow on the Jato small- scale irrigation scheme, a correction factor was applied.
V mean = K *Vsu (5)
Since the measurement was taken at the surface due to the external factors that affect the tennis ball like wind and wave action, a correction factor (K) of 0.85 was taken for safety factors [10].
The cross-sectional area of the flow perpendicular to the direction of flow is multiplied by the average water velocity to estimate the flow rate.
Thus, discharge can be calculated by the area-velocity method based on [10].
Q = 0.85*A*Vmean (6)
Where Q is the discharge rate in cubic meters per second (m3/sec), A is the cross-sectional area of the channel square meter (m2) and V is the velocity of the floating object meters per second (m/sec).

2.5.2. Secondary Data Collection

Secondary data collection was carried out by visiting different related government sectors. This information includes the irrigated area, meteorological data, Soil data to calculate crop water requirement, irrigation requirement, and different crop data from the agricultural office and other necessary materials.

2.6. Data Analysis Techniques

The data were collected from both primary and secondary sources. Meteorological data and Soil data were analyzed using Cropwat8.0 software, and Microsoft Excel (spreadsheet). The results are presented in the table and graph formats. Data collected from interviews and field observations were qualitatively assessed.

2.7. Determination of Effective Rainfall

In the past, different methods were proposed for effective rainfall estimation and these methods are direct measurement method, empirical method, or soil water balance methods; and the best result is obtained by soil water balance methods.
These methods include a fixed percentage of rainfall, dependable rainfall, empirical formula, and the USDA Soil Conservation Service Method.
Effective rainfall can be calculated using the following formulae.
Peff = Pmon125-0.2*Pmon125, for Pmon 250 mm (7)
Peff = 125 + 0.1 * Pmon, for Pmon > 250 mm (8)
When Rain (mm) & Eff rain (mm)

2.8. Determination of CWR and IWR

The CROPWAT8.0 was used to calculate the crop water requirement (CWR) and irrigation water requirement (IWR) of the irrigated crops at the field level and the irrigation scheme as a whole. By using the Penman-Monteith method to calculate reference evapotranspiration, this model may determine how much water is needed for crops. The model needs climatic information, such as the mean monthly precipitation, minimum and maximum temperature (oc), relative humidity (%), wind speed (km/day), and sunshine hours (hr), to calculate the reference evapotranspiration (ETO) value. After estimating effective rainfall using the USDA Soil Conservation Service (SCS) method, the determination of IWR was carried out.
ETcr = ETo x Kc (9)
However, ETcr = is crop water need
ETo = Reference crop evapotranspiration in millimeters per day, and Kc = Crop coefficient

2.9. Determination Internal Performance Indicators

2.9.1. Canal Conveyance Efficiency

Canal conveyance efficiency (Ec) is the ratio in percent of the amount of water delivered by a channel or pipeline to the amount of water delivered to the conveyance system, [13]. Ec was computed using the following formula.
Ec = Q0Qi*100%. (10)
Where Ec is conveyance efficiency (%); Qo = quantity of water delivered by a conveyance system (outlet); and
Qi = quantity of water delivered to a conveyance system (inflow).
If conveyance efficiency is greater than one (Ec >1 implies more water leaves a specific canal section than that which enters it, while if equal to one (Ec=1) implies there is no water loss over the section under consideration. If conveyance efficiency is less than one (Ec < 1) indicates that there was water loss in the section and therefore a need for maintenance of the system.

2.9.2. Canal Conveyance loss

It measures the efficiency of the canal system during conveying water by losing water over a given travel distance. A water conveyance loss ratio can be calculated for each section of the main & secondary canal as recommended by. Therefore, the Lc is calculated as;
Lc = (Qi-Q0)Qi*100% (11)
Where Lc - is the water conveyance loss expressed as a percentage [%], and Qi & Qo - is the total water flowing into and out of a specific section of the canal (l /s).

2.9.3. Field Application Efficiency

The field application ratio for surface irrigation should be found between 0.6 and 0.92 [15]. The field application ratio (Ea) has the same structure as the overall consumed ratio. It is defined as.
Ea =ETp-PeVolume of water delivered at field(s)  (12)
Where ETp is potential evapotranspiration by the irrigated crop and Pe is the effective part of the precipitation.

2.9.4. Overall Scheme Efficiency

The overall scheme efficiency (Ep) was calculated as the product of conveyance (Ec) and application efficiency (Ea). It was computed using the following formula [16].
Ep = Ec∗Ea (13)

2.10. Physical Performance Indicator

2.10.1. Irrigation Ratio

Physical indicators are related to the changing or losing irrigated land in the command area for different reasons. The selected indicator used for the evaluation of physical performance was the irrigation ratio which can be expressed as follows [11, 15].
IR = Current irrigated areaDesigned command arae (14)
Where IR is the irrigation ratio in %, current Irrigated area (ha) is the portion of the irrigated land (ha) in any given Irrigation season, and command area (ha) is the potential scheme command area.

2.10.2. Effectiveness of Infrastructures

Three basic goals of maintenance are intended to be attained: safety, maintaining canals in a condition that minimizes Seepage and maintains canal water ranges and the supposed discharge head dating, and keeping water manipulated infrastructure. The conveyance efficiency of Irrigation systems is the finest means of determining whether canal maintenance is necessary. It should be possible to construct parameters that let you know when canal cleaning or reshaping is needed by way of tracking the adjustments in conveyance efficiencies over time. Instead of taking a more analytical approach, this is frequently done subjectively based on appearance in many systems. The effectiveness of infrastructure is the ratio of the number of functioning structures over the total number of structures to be installed during construction time [11, 15].
EI = Number of functioning structures Total number of structures  (15)

2.10.3. Water Surface Elevation Ratio

The water surface elevation ratio (WSER) is an important indicator that aims to assess the impact of sedimentation and erosion problems on the main canal of the irrigation scheme . The water surface elevation ratio (WSER) can be calculated as.
WSER=Current water surface elevation at FSLRequired water surface elevation at FSL  (16)
3. Results and Discussions

3.1. Rainfall Data Analysis

The minimum and maximum rainfall amount occurs in January (16.8 mm) and August (334mm), respectively. The study area has an average total annual rainfall of 1899.6 mm. Scheduling irrigation based on crop demand requires an estimate of effective precipitation or rainfall. Effective rainfall estimates are also important for planning cropping sequences in irrigation crop production. Effective rainfall is the amount of rainfall stored in the crop root zone. Rainfall that runs off the soil surface or passes through the root zone does not contribute to crop growth and yield. As can be seen from Table 2 the highest effective rainfall occurs during August and is about 158.4mm. The total annual effective rainfall of the area is 1106.4mm.
Table 2. Monthly effective rainfall of the area (USDA S.C Method).

From 1992-2021 G.C

Month

Rainfall depth (mm)

Effective rainfall (mm)

January

16.8

16.3

February

20.4

19.7

March

45.6

42.3

April

98.3

82.8

May

232.7

146.1

June

322

157.2

July

321.5

157.2

August

334

158.4

September

300.9

155.1

October

140.4

108.9

November

46.6

43.1

December

20.2

19.5

Average

158.3

92.2

Figure 5. Relationship between rainfall and effective rainfall.
Table 3. Monthly reference evapotranspiration ETo (CROPWAT output) for the study area.

Month

Min Temp °C

Max Temp °C

Humidity %

Wind km/day

Sun Hours

Rad MJ/m²/day

ETo mm/day

January

13.1

26.9

61

95

7.9

19.2

3.76

February

14.8

29

55

112

7.7

20.2

4.35

March

16.3

30.5

55

121

7.4

20.7

4.77

April

17

29.2

61

112

7.2

20.5

4.62

May

16.8

26.7

74

78

5.6

17.7

3.76

June

15.9

23.6

84

69

4.3

15.4

3.1

July

15.1

22.3

87

104

3.3

14.1

2.76

August

15.1

23.3

87

78

3.4

14.4

2.83

September

15.4

24.5

85

78

4.2

15.8

3.12

October

14.3

24.9

76

104

6.7

18.7

3.65

November

12.9

25.6

71

104

7.3

18.5

3.6

December

12.4

25.8

66

104

7.3

17.9

3.5

Average

14.9

26

72

96

6

17.8

3.65

Figure 6. ETo variation on each month.

3.2. Determination of Reference Evapotranspiration (ETo)

As discussed in the methodology, ETo was determined by CROPWAT 8.0 software using Penman-Monteith equation. Table 3 shows a summary of the monthly ETo in the study area. The minimum and maximum monthly ETo values of the irrigation scheme were 2.76mm/day in July and 4.77mm/day in March. The annual average value of ETo was 3.65mm/day indicated in Table 3.

3.3. Crop and Water Requirements of Major Crops

3.3.1. Crop and Irrigation Water Requirements of Tomato Crop

CropWat8.0 software was used to calculate the crop and irrigation needs of tomato crops. Tomatoes require 399.4 mm of irrigation water overall, according to the computation result by software. The plant could employ 179.7 mm of the effective rainfall that was available. In February and March, the tomato crop has its highest irrigation need, as seen in Table 4. As a result, the highest irrigation demand was recorded in February and March, with 112.1 and 124.1mm/dec, respectively. The reason behind this is that during these months, there was a considerable need for crop water due to the effective rainfall's 5.7 mm depth.
Table 4. Crop Water Requirements for Tomato crop.

Month

Decade

Stage

Kc coeff

ETc mm/day

ETc mm/dec

Eff rain mm/dec

Irr. Req. mm/dec

Dec

1

Init

0.6

2.12

6.4

2.6

6.4

Dec

2

Init

0.6

2.1

21

5.6

15.4

Dec

3

Init

0.6

2.15

23.7

5.5

18.1

Jan

1

Deve

0.61

2.25

22.5

5.6

16.9

Jan

2

Deve

0.73

2.74

27.4

5.2

22.2

Jan

3

Deve

0.87

3.44

37.9

5.7

32.2

Feb

1

Deve

1.01

4.2

42

5.6

36.4

Feb

2

Mid

1.13

4.9

49

5.7

43.3

Feb

3

Mid

1.14

5.12

41

8.5

32.4

Mar

1

Mid

1.14

5.28

52.8

11.1

41.8

Mar

2

Mid

1.14

5.44

54.4

13.3

41.1

Mar

3

Mid

1.14

5.39

59.2

18.1

41.2

Apr

1

Late

1.09

5.07

50.7

22.4

28.3

Apr

2

Late

0.96

4.45

44.5

26.6

18

Apr

3

Late

0.84

3.65

36.5

33.9

2.6

May

1

Late

0.77

3.14

3.1

4.3

3.1

Total

572.1

179.7

399.4

The crop water requirement graph for tomato crops represents the amount of water needed by the crop at different growth stages to achieve optimal yields and quality. The graph typically includes a horizontal axis representing time (in days or weeks) and a vertical axis representing the amount of water needed (in millimeters). Understanding the crop water requirement graph for tomatoes is important for farmers to optimize irrigation scheduling and conserve water resources while ensuring optimal yields and quality.
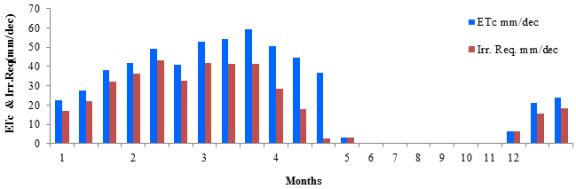
Figure 7. Crop water requirement graph of Tomato crop.
An irrigation schedule for tomatoes refers to a plan for applying water to the crop at regular intervals throughout the growing season. The schedule is designed to provide the crop with the right amount of water at the right time to meet its water requirements and ensure optimal growth, yield, and quality.
Table 5. Irrigation schedule of Tomato.

Date

Day

Stage

Rain mm

Ks Fract.

Eta %

Depl %

Net Irr mm

Deficit mm

Loss Mm

Gr. Irr mm

Flow l/s/ha

6-Jan

30

Init

0

1

100

30

50.3

0

0

71.9

0.28

14-Feb

69

Dev

0

1

100

40

116.2

0

0

165.9

0.49

15-Mar

98

Mid

0

1

100

41

120

0

0

171.4

0.68

1-May

End

End

0

1

0

32

Total

286.5

409.2

1.45

Figure 8. Irrigation scheduling graph of Tomato.
An irrigation scheduling for tomatoes is a visual representation of the crop's water requirements at different growth stages and the amount of water applied through irrigation as shown in Figure 8. The graph typically shows the soil moisture level, rainfall, and irrigation events over time.

3.3.2. Crop Water Requirements of Potato Crop

35 percent of the irrigated land was planted with potatoes, according to the field survey. Table 6 shows the results of the calculations for the effective rainfall and irrigation water requirements. Crop water requirements of potatoes refer to the amount of water needed by the potatoes crop at different stages of growth to achieve optimal yields and quality. The water requirements of potatoes are influenced by various factors such as temperature, humidity, wind, soil type, and crop management practices. The crop water requirement of potatoes can be determined using a crop water requirement graph, which represents the amount of water needed by the crop at different stages of growth. The graph typically includes a horizontal axis representing time (in days or weeks) and a vertical axis representing the amount of water needed (in millimeters).
Table 6. Crop water requirements of Potato crop.

Month

Decade

Stage

Kc coeff

ETc mm/day

ETc mm/dec

Eff rain mm/dec

Irr. Req. mm/dec

Nov

3

Init

0.5

1.78

14.3

8.4

3.8

Dec

1

Init

0.5

1.77

17.7

8.5

9.2

Dec

2

Deve

0.51

1.79

17.9

5.6

12.4

Dec

3

Deve

0.69

2.48

27.3

5.5

21.7

Jan

1

Deve

0.91

3.36

33.6

5.6

28

Jan

2

Mid

1.11

4.16

41.6

5.2

36.4

Jan

3

Mid

1.14

4.5

49.5

5.7

43.9

Feb

1

Mid

1.14

4.72

47.2

5.6

41.6

Feb

2

Mid

1.14

4.95

49.5

5.7

43.7

Feb

3

Mid

1.14

5.11

40.9

8.5

32.3

Mar

1

Late

1.09

5.05

50.5

11.1

39.4

Mar

2

Late

0.96

4.58

45.8

13.3

32.5

Mar

3

Late

0.82

3.87

42.6

18.1

24.5

Apr

1

Late

0.74

3.46

3.5

2.2

3.5

Total

481.7

109

372.9

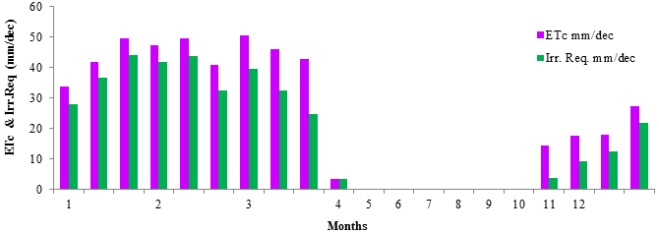
Figure 9. The crop water requirement graph of Potato crop.
As indicated by Table 6 and Figure 9, irrigation was required for the duration of the crop's growth season. The potato crop's water needs peaked in January and February of that year. Therefore, 108.3 mm and 117.6 mm, respectively, were the amounts of peak irrigation demand in January and February. 109 mm of effective rainfall is anticipated to be available for plant use, while the total irrigation water requirement for the potato growing season was 372.9 mm.

3.3.3. Crop Water Requirements of Pepper

According to the field survey, pepper was grown on 12% of all irrigated acreage. The software's computation output showed that 335.8 mm of irrigation water was needed overall for pepper. There was 121.1 mm of effective rainfall that the plants could use. As can be observed in Table 7, Crops required irrigation for the whole of their growing season. The peak irrigation demand was recorded in February and March, with corresponding values of 102.3 mm and 108.3 mm. During the pepper growing season, 335.8 mm of irrigation water was needed overall, and 121.1 mm of effective rainfall was estimated to be available for plant use. Table 7 shows the results of the calculation of the effective rainfall and irrigation water requirements.
Table 7. Crop water requirements of pepper.

Month

Decade

Stage

Kc Coeff

ETc mm/day

ETc mm/dec

Eff rain mm/dec

Irr. Req. mm/dec

Dec

1

Init

0.6

2.12

2.1

0.9

2.1

Dec

2

Init

0.6

2.1

21

5.6

15.5

Dec

3

Init

0.6

2.16

23.7

5.5

18.2

Jan

1

Deve

0.6

2.22

22.2

5.6

16.6

Jan

2

Deve

0.69

2.61

26.1

5.2

20.9

Jan

3

Deve

0.83

3.27

36

5.7

30.3

Feb

1

Deve

0.96

3.98

39.8

5.6

34.1

Feb

2

Mid

1.04

4.51

45.1

5.7

39.4

Feb

3

Mid

1.04

4.66

37.3

8.5

28.8

Mar

1

Mid

1.04

4.81

48.1

11.1

37.1

Mar

2

Mid

1.04

4.96

49.6

13.3

36.3

Mar

3

Late

1.02

4.82

53

18.1

34.9

Apr

1

Late

0.94

4.4

44

22.4

21.6

Apr

2

Late

0.89

4.11

12.3

8

0

Total

460.4

121.1

335.8

A crop water requirement graph for pepper is a visual representation of the amount of water that the crop needs at different stages of growth. The graph typically includes a horizontal axis representing time (in days or weeks) and a vertical axis representing the amount of water needed (in millimeters). The crop water requirement graph for pepper is based on several factors, including the crop's evapotranspiration rate (ETo), which is the amount of water lost through evaporation from the soil and transpiration from the plant's leaves.
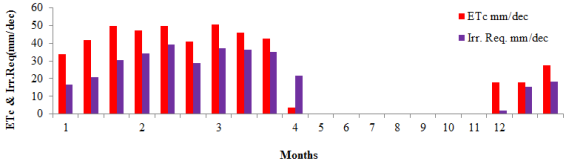
Figure 10. Crop water requirement graph of Pepper crop.

3.3.4. Crop Water Requirements of Wheat

According to the field survey, wheat occupied 38% of the total irrigated land. Table 8 shows the calculated effective rainfall and irrigation water requirements. Irrigation was required for the whole crop's growing season. The wheat crop's water consumption peaked in February and March. Therefore, during February and March, the amount of irrigation demand that peaked was 117.7 mm and 103.6 mm, respectively. During the wheat growing season, 298.9 mm of irrigation water was needed, while 125.4 mm of effective rainfall was predicted to be available for plant use.
Table 8. Crop Water Requirements of Wheat.

Month

Decade

Stage

Kc coeff

ETc mm/day

ETc mm/dec

Eff rain mm/dec

Irr. Req. mm/dec

Dec

1

Init

0.3

1.06

6.4

5.1

2.1

Dec

2

Init

0.3

1.05

10.5

5.6

4.9

Dec

3

Init

0.3

1.08

11.8

5.5

6.3

Jan

1

Deve

0.38

1.39

13.9

5.6

8.3

Jan

2

Deve

0.65

2.44

24.4

5.2

19.2

Jan

3

Deve

0.94

3.73

41

5.7

35.4

Feb

1

Mid

1.14

4.72

47.2

5.6

41.5

Feb

2

Mid

1.14

4.95

49.5

5.7

43.8

Feb

3

Mid

1.14

5.11

40.9

8.5

32.4

Mar

1

Mid

1.14

5.27

52.7

11.1

41.7

Mar

2

Late

1.08

5.15

51.5

13.3

38.2

Mar

3

Late

0.8

3.79

41.7

18.1

23.7

Apr

1

Late

0.51

2.38

23.8

22.4

1.4

Apr

2

Late

0.33

1.52

4.5

8

0

Total

420

125.4

298.9

The graph may include different lines or bars representing different irrigation treatments or soil moisture levels. For example, one line may represent the actual amount of water received by the crop, while another line may represent the ideal amount of water needed based on local weather conditions and soil type.
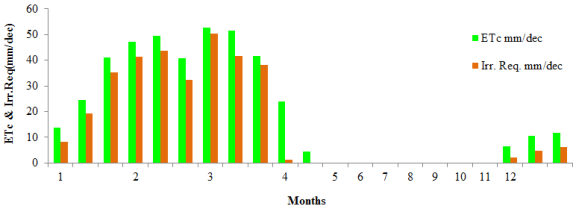
Figure 11. Crop water requirements graph of wheat.
Cropwat8.0 was used to compute the irrigation scheduling, as indicated in Table 13. This makes it easier to assess and compare the selected fields' efficiencies to the optimal and helps to establish similar conditions with the farmers' irrigation techniques. Because farmers are unable to assess and monitor the soil moisture levels of the soil before irrigation, scheduling should take application strategies into account throughout the growing stages. These options need to be carefully considered, with recommendations based on local studies.
Table 9. Irrigation schedule of Wheat.

Date

Day

Stage

Rain mm

Ks Fract.

Eta

Depl

Net Irr Mm

Deficit mm

Loss mm

Gr. Irr mm

Flow l/s/ha

28-Feb

86

Mid

0

1

100

56

194.8

0

0

278.3

0.37

13-Apr

End

End

53.3

1

100

25

Total

194.8

278.3

0.37

An irrigation scheduling for wheat is a visual representation of the recommended frequency and amount of water to be applied to the crop at different stages of growth as indicated in Figure 12. The graph typically includes a horizontal axis representing time (in days or weeks) and a vertical axis representing the amount of water to be applied (in millimeters).
Figure 1. Irrigation scheduling graph of wheat.

3.4. Results of Conveyance Efficiency

The operating gates regulate the canal's discharge. A diversion weir also controls the main source, the Jato stream, from which the discharge in the main canals varies periodically. There are several constructions built on the main canals, division box, and turnout. The following tables list the water flow measurement results for Jato's small-scale Irrigation scheme, with a weir installed in the main canal on February 20, March 22, and April 26, 2023 G.C.
Measurements taken in this during the dry season in February, March, and April indicate that the average discharge of 43 liters per second is within the average of 53.6 45.4 & 29.9 liters per second. The conveyance efficiency varied within the day, at the head, middle, and tail sections during the season of the scheme as can be seen in Tables 10, 11, &12. The average conveyance efficiency of the lined main canal was 70% as indicated in Table 13.
The average conveyance efficiency should be 75% for concrete-lined canals. Since the value of conveyance efficiency of the canal is less than 1 there is water loss in the main canal and therefore a need for maintenance of the system. The amount of water lost will determine the need for maintenance of the system. It is recommended that the conveyance efficiency of the concrete lined -canal should be above 75%.
Table 10. Water flow measurement results for Day 1 on February 20, 2023 G.C.

Type of canal

Station

Time symbol

Measurement(sec)

Width (m)

Depth of water in canal(m)

Surface velocity(m/s)

Correction factor

Mean Velocity(m/s)

Area(m2)

Q(l/s)

Lined main canal

Head

T1

34

0.4

0.4

0.44

0.85

0.37

T2

33

0.4

0.4

0.45

0.85

0.38

T3

34

0.4

0.4

0.44

0.85

0.37

Avg

33.7

0.4

0.4

0.45

0.85

0.38

0.16

60.8

Lined main canal

Middle

T1

35

0.4

0.35

0.43

0.85

0.37

T2

34

0.4

0.35

0.44

0.85

0.37

T3

37

0.4

0.35

0.41

0.85

0.35

Avg

35.3

0.4

0.35

0.43

0.85

0.37

0.14

51.8

Unlined main canal

Tail

T1

41

0.4

0.35

0.43

0.85

0.37

T2

45

0.4

0.28

0.33

0.85

0.28

T3

43

0.4

0.28

0.35

0.85

0.30

Avg

43

0.4

0.28

0.35

0.85

0.30

0.11

33

Table 11. Water flow measurement results for Day 2 on March 22, 2023 G.C.

Type of canal

Station

Time symbol

Measurement(sec)

Width (m)

Depth of water in canal(m)

Surface velocity(m/s)

Correction factor

Mean Velocity(m/s)

Area(m2)

Q(l/s)

Lined main canal

Head

T1

37

0.4

0.36

0.41

T2

35

0.4

0.36

0.41

0.85

T3

36

0.4

0.36

0.41

Avg

36

0.4

0.36

0.41

0.85

0.35

0.15

52.5

Lined main canal

Middle

T1

37

0.4

0.32

0.41

T2

36

0.4

0.32

0.42

0.85

T3

39

0.4

0.32

0.39

Avg

37.3

0.4

0.32

0.40

0.85

0.34

0.13

44.2

Unlined main canal

Tail

T1

43

0.4

0.28

0.35

T2

47

0.4

0.28

0.32

0.85

T3

45

0.4

0.28

0.33

Avg

45

0.4

0.28

0.33

0.85

0.28

0.11

30.8

Table 12. Water flow measurement results for Day 3 on April 26, 2023 G.C.

Type of canal

Station

Time symbol

Measurement(sec)

Width (m)

Depth of water in canal(m)

Surface velocity(m/s)

Correction factor

Mean Velocity(m/s)

Area(m2)

Q(l/s)

Lined main canal

Head

T1

38

0.4

0.34

0.40

T2

37

0.4

0.34

0.41

0.85

T3

38

0.4

0.34

0.40

Avg

37.7

0.4

0.34

0.40

0.85

0.34

0.14

47.6

Lined main canal

Middle

T1

40

0.4

0.32

0.38

T2

42

0.4

0.32

0.36

0.85

T3

42

0.4

0.32

0.36

Avg

41.3

0.4

0.32

0.36

0.85

0.31

0.13

40.3

Unlined main canal

Tail

T1

48

0.4

0.25

0.31

T2

45

0.4

0.25

0.33

0.85

T3

49

0.4

0.25

0.31

Avg

47.3

0.4

0.25

0.32

0.85

0.27

0.1

27

Table 13. Average conveyance efficiency & loss in the lined &unlined main canal.

Canal type

Required inflow

Head

Middle

Tail

Average outflow

CE

CL

l/s

l/s

l/s

l/s

l/s

%

%

LMC & UMC

61.15

53.6

45.4

30.3

43

70

30

3.5. Physical Performance Indicators Results

3.5.1. Irrigation ratio

Physical indicators are related to the changing or losing irrigated land in the command area for different reasons. The irrigation ratio of the Jato small-scale irrigation scheme was 80 which means about 20% of the command area of the scheme was not under irrigation during the study period as indicated in Table 14. The computed values of the sustainability irrigated area of the Jato scheme were below one, which indicated that the current irrigated area was below the proposed values during the construction period of the irrigation scheme. The reduction of the command area was due to water scarcity and poor maintenance activity of the scheme.
Table 14. Data of command areas and value of Physical indicator of the scheme.

Jato irrigation command area

Unit

Extent

Required irrigated area

ha

75

Current irrigated area

ha

60

Irrigation ratio

%

80

3.5.2. Effectiveness of infrastructures

The effectiveness of infrastructure is a critical factor in the success of the Jato small-scale irrigation scheme. The studies have shown that infrastructure accounts for up to 66.7% of the value of the Jato small-scale irrigation scheme as indicated in Table 15. Effective infrastructure can improve the conveyance efficiency of canals, reduce water losses due to seepage and evaporation, and provide reliable water sources for irrigation. This can lead to increased crop yields, improved food security, and higher incomes for farmers. However, poorly designed or maintained infrastructure can lead to water shortages, crop failure, and even environmental degradation. Therefore it is important to invest in high-quality infrastructure and ensure that it is properly maintained over time. This requires ongoing investment and support from governments, NGOs, and other stakeholders to ensure that the Jato small-scale irrigation scheme can continue to provide benefits to farmers and communities over the long term.
Table 15. Observed structures status

List of Structure

№ of Structures

Partly functioning

Fully Functioning

% of Fully Functioning

Intake

12

8

4

33.33

Diversion Weir

1

0

1

100

Sluice gate

1

1

0

0

Drainage Culvert

3

2

1

33.33

Division Box

1

0

1

100

Inlet

2

1

1

50

Siphon

2

0

2

100

Foot path

10

2

8

80

chute

8

4

4

50

Turnout

20

2

18

90

Total

60

20

40

66.7

3.5.3. Water Surface Elevation Ratio Result

This parameter is also called canal water level ratio, which is focused on different sections of the main canal and secondary canal. As per the design document shown in Table 16; the required water level depth in the main canal from the bottom was 0.5m at the full supply level. The current average water surface elevation at full supply level was found to be 66% (0.33m) for the main canal section. This shows a 34% of WSE at FSL was reduced from the required water depth of the main canal as shown in Table 16. Therefore, the average WSER through the head, middle, and tail reaches was less than one. In general, the main canal system of the Jato irrigation scheme did not have a maintenance schedule to remove sediment buildup and weed incidence.
Table 16. Overall average WSER in the main canal

Type of canal

Required(m)

Current(m)

WSER (%)

Lined & Unlined MC

0.5

0.33

66

4. Conclusions
Assessing the performance of the conveyance system of the Jato small-scale irrigation scheme is the main objective of the study. Assessing the performance of the conveyance system of the Jato small-scale irrigation scheme is the main objective of the study. From investigations made during the study, the conclusions outlined below can be drawn.
1. By using water balance indicators to evaluate the data, the conveyance efficiency is good, with a conveyance efficiency of 70%, and the application efficiency and overall consumed efficiency have values of 70% and 50%, respectively.
2. The results for the Jato small-scale irrigation scheme show that the system is not only unable to provide the required amount of water for the crops but also fails to supply the water concerning the amount of intended water.
3. The indicators' values show that the irrigation effectiveness of infrastructure is low with a value of 66.7%.
4. It was 70% for the field application efficiency. The total consumption efficiency was found to be 50%, which is much less than the optimum efficiency which is one. This demonstrates that the crop is not irrigated using the available water, even when it is insufficient. It is evident from the scenario that the water provided by the program is not only used for irrigation purposes but also serves as a source of drinking water for animals.
5. With a conveyance of 70%, the main canal's capacity to not satisfy peak crop demand is indicated by a number that is less than one. In general, this indicates that the channel can transport water from the sources to the fields if it is available.
6. The effectiveness of a structure is the number of structures in good conditions, divided by the total number of structures. Poor can be defined as not functioning adequately, or the risk of failing and the ideal optimum is one. At the farmers' field level, there was a glaring lack of irrigation water management. Because farmers' management expertise is significantly below what was applied, low efficiency was attained.
7. Farmers were applying excess amounts of water to their fields without considering the crop water requirement of the crop.
8. In conclusion, assessing the performance of a conveyance system in the Jato small-scale irrigation scheme is critical to ensure that the system is functioning efficiently and effectively. By identifying any issues and implementing appropriate solutions, farmers can maximize their crop yields while minimizing water wastage and energy consumption.
5. Recommendations
The following recommendations were drawn from the assessing the performance of the conveyance system of the Jato small-scale irrigation scheme:
1. It is recommended that night storage be designed that can be used to store water during off-peak hours and release it during peak hours when the water demand is higher.
2. It is also recommended that farmers be made aware of the system through the Water Users Association to motivate them to take part in its maintenance.
3. Efficient infrastructure such as pipes and distribution networks be designed to minimize water loss and maximize water delivery to the crops is necessary.
4. Around the head structure the soil exists with sand, gravels and within an irregular form the weathered basalt rock is exposed, which makes a laborious to excavate. In this mentioned area existed the water seepage and eroded problems that need the necessary measures.
5. Along the weir axis from the right side there is soil, gravel, and pebble size which cause seepage, erode, and head work slide if not excavated.
6. It is recommended that establishing a system for regular monitoring and evaluation of the performance of the project is a vital role in identifying any challenges or areas for improvement, ensuring the project remains effective and sustainable.
7. Additional efforts are necessary to pinpoint any issues and address them effectively, or propose viable remedies.
Author Contribution
Abera Asefa: Analyzed and interpreted the data; materials, analysis tools or data; Wrote the paper
Dereje Adeba: Advisor, Conceptualization, Methodology analysis tools or data
Gemechu Mosisa: Conceptualization, analysis tools or data, Data curation, Methodology, Writing - review & editing
Data Availability
All information provided to this publication is presented in the full document/the data that has been used is confidential.
Acknowledgements
First of all, I want to give my sincere and special thanks to my advisor, Dr. Dereje Adeba, for his mentorship, encouragement, unconditional support, constructive and timely comments, and all-around support he has given me at all stages of my work. Secondly, I would like to express my deepest gratitude to my special friend who also supported me through their friendship and who stood with me Mr. Gemechu Mosisa (M.Sc.) through his contribution to his appreciable ideas. Last but not least, I would like to express my deepest gratitude to Wallaga University for giving me a free scholarship.
Conflicts of Interest
The author declares that they have no conflicts of interest.
References
[1] A. Y. Gebremedhn and and P. Singh, “Evaluation of Water Delivery Performance in Robit Small_Scale Irrigation Scheme, Amhara, Ethiopi,” Irrig. Drain. Syst. Eng., vol. 9, no. 4, 2020.
[2] T. Legesse and A. Tadesse, “Evaluation of Water Delivery Performance and Conveyance Efficiency in Gatto Small-Scale Irrigation Scheme, Southern, Ethiopia,” J. Water Resour. Ocean Sci., vol. 10, no. 5, p. 139, 2021,
[3] S. N. Kang’au, P. G. Home, and J. M. Gathenya, “Farm water use Efficiency assessment for Smallholder Pumped Irrigation Systems in the arid and Semi-Arid areas of Kenya,” Agric. Eng. Int. CIGR J., vol. 13, no. 4, 2011.
[4] S. B. Awulachew, “Irrigation potential in Ethiopia,” ResearchGate, vol. 1, no. July, p. 60, 2010.
[5] M. A. SB Awulachew, “Performance Of Irrigation: an Assessment at Different Scales in Ethiopia,” 2011.
[6] M. of A. and N. Resources, “Ethiopia has a total potential arable land of approximately 74 million hectares.,” 2017.
[7] T. M. Mesfin Meja, Matusala Bassa, “Assessing the Challenges of Irrigation Development in Ethiopia: A Review,” Int. J. Eng. Res. Technol., vol. 9, no. 2, 2020.
[8] G. G. Haile, “Irrigation in Ethiopia, a Review,” vol. 5, no. 15, pp. 141–148, 2015.
[9] Mesfin Meja, Matusala Bassa, and Teketel Mirkeno, “Assessing the Challenges of Irrigation Development in Ethiopia: A Review,” Int. J. Eng. Res., vol. V9, no. 01, pp. 215–221, 2020,
[10] G. Mosisa and A. Dereje, “Hydraulic Performance Evaluation of Diversion Weir and Canal Structures: Case Study of Basaka Small Scale Irrigation Scheme, Wayu Tuka, East Wallaga, Oromia, Ethiopia,” Am. J. Sci. Eng. Technol., vol. 8, no. 3, pp. 152–161, 2023.
[11] S. S. Wane and M. B. Nagdeve, “Estimation of evapotranspiration and effective rainfall using CROPWAT,” Int. J. Agric. Eng.|, vol. 7, no. 1, pp. 23–26, 2014.
[12] A. A. HAILE, “Performance Evaluation of Ariyo-Kulano Small Scale Irrigation Scheme in Kucha Woreda, Snnpr, Ethiopia,” 2018.
[13] Y. Wakena, D. Adeba, G. Mosisa, and K. Abebe, “Performance Evaluation of Small Scale Irrigation System in Case of Degero and Gura Daso, Nejo District, West Wallaga, Oromia, Ethiopia,” Frontiers (Boulder)., vol. 3, no. 3, pp. 24–35, 2023,
[14] E. A. K., K. S.-A. L., and D. O.-S. J., “Assessing the performance of an irrigation scheme in Okyereko, Ghana,” J. Agric. Ext. Rural Dev., vol. 9, no. 12, pp. 270–282, 2017,
[15] C. Cater, “Performance Indicators for Equity,” Educ. Manag. Adm. Leadersh., vol. 18, no. 2, pp. 50–54, 1990,
[16] H. Tesfaye, “Technical Performance Evaluation of Small-Scale Irrigation Scheme at Wondo Genet, Ethiopia,” J. Resour. Dev. Manag., vol. 68, 2020.
[17] Y. A. Z. Mekonnen, G. Sintayehu, A. Hibu, “Performance Evaluation of Small-Scale Irrigation Scheme: a Case Study of Golina Small-Scale Irrigation Scheme, North Wollo, Ethiopia,” 2022.
Cite This Article
  • APA Style

    Asefa, A., Adeba, D., Mosisa, G. (2024). Assessing the Performance of Conveyance System of Jato Small-Scale Irrigation Scheme of Wayu-Tuka District, East Wallaga Zone, Oromia, Ethiopa. American Journal of Civil Engineering, 12(2), 48-65. https://doi.org/10.11648/j.ajce.20241202.11

    Copy | Download

    ACS Style

    Asefa, A.; Adeba, D.; Mosisa, G. Assessing the Performance of Conveyance System of Jato Small-Scale Irrigation Scheme of Wayu-Tuka District, East Wallaga Zone, Oromia, Ethiopa. Am. J. Civ. Eng. 2024, 12(2), 48-65. doi: 10.11648/j.ajce.20241202.11

    Copy | Download

    AMA Style

    Asefa A, Adeba D, Mosisa G. Assessing the Performance of Conveyance System of Jato Small-Scale Irrigation Scheme of Wayu-Tuka District, East Wallaga Zone, Oromia, Ethiopa. Am J Civ Eng. 2024;12(2):48-65. doi: 10.11648/j.ajce.20241202.11

    Copy | Download

  • @article{10.11648/j.ajce.20241202.11,
      author = {Abera Asefa and Dereje Adeba and Gemechu Mosisa},
      title = {Assessing the Performance of Conveyance System of Jato Small-Scale Irrigation Scheme of Wayu-Tuka District, East Wallaga Zone, Oromia, Ethiopa
    },
      journal = {American Journal of Civil Engineering},
      volume = {12},
      number = {2},
      pages = {48-65},
      doi = {10.11648/j.ajce.20241202.11},
      url = {https://doi.org/10.11648/j.ajce.20241202.11},
      eprint = {https://article.sciencepublishinggroup.com/pdf/10.11648.j.ajce.20241202.11},
      abstract = {The performance assessment of a small-scale irrigation project plays a vital role in evaluating its effectiveness and addressing potential shortcomings in achieving desired outcomes. This study aims to provide a comprehensive analysis of the Jato small-scale irrigation project, assessing its performance based on various criteria and indicators. The study evaluates the project's infrastructure maintenance and system efficiency. The designed command area of the scheme is seventy-five (75 ha) but the current irrigated area of the scheme is sixty (60ha) only. To achieve the objectives, primary and secondary data were collected. To gather both primary and secondary data, data-gathering techniques include surveys, interviews, field observations, and meteorological data. Before, during, and after an irrigation event, while farmers were carrying out their regular irrigation practices, several field characteristics were measured and/or observed. These data included the type of crop, irrigation water discharge in the canal, and field size. A survey concerning the availability of water was also carried out among farmers. CROPWAT 8.0 Software was used to organize the crop pattern of the study area along with other relevant data, including soil, climate, rain crop, and crop pattern. Water flow measurement results of the Jato small-scale irrigation scheme at the head, middle, and tail of the lined & unlined main canal were found to be 53.6l/s, 45.4 l/s, and 29.9l/s respectively. The average water flow measurement result of the scheme is 43l/s which reduced from required flow by 18.15l/s. From the analyses of the water balance indicators, the canal conveyance efficiency, canal conveyance loss, application efficiency, and overall efficiency were found to be 70%, 30%, 70%, and 50% respectively. The overall average main canal conveyance efficiency and water conveyance loss were below the recommended values. The studies have shown that the effective infrastructure, irrigation ratio, and water surface elevation ratio of the scheme were found to be 66.7%, 80%, and 66% respectively. However, there were certain areas for improvement identified, such as the need for better coordination among project stakeholders and enhanced maintenance practices to ensure the long-term functionality of irrigation infrastructure.
    },
     year = {2024}
    }
    

    Copy | Download

  • TY  - JOUR
    T1  - Assessing the Performance of Conveyance System of Jato Small-Scale Irrigation Scheme of Wayu-Tuka District, East Wallaga Zone, Oromia, Ethiopa
    
    AU  - Abera Asefa
    AU  - Dereje Adeba
    AU  - Gemechu Mosisa
    Y1  - 2024/04/29
    PY  - 2024
    N1  - https://doi.org/10.11648/j.ajce.20241202.11
    DO  - 10.11648/j.ajce.20241202.11
    T2  - American Journal of Civil Engineering
    JF  - American Journal of Civil Engineering
    JO  - American Journal of Civil Engineering
    SP  - 48
    EP  - 65
    PB  - Science Publishing Group
    SN  - 2330-8737
    UR  - https://doi.org/10.11648/j.ajce.20241202.11
    AB  - The performance assessment of a small-scale irrigation project plays a vital role in evaluating its effectiveness and addressing potential shortcomings in achieving desired outcomes. This study aims to provide a comprehensive analysis of the Jato small-scale irrigation project, assessing its performance based on various criteria and indicators. The study evaluates the project's infrastructure maintenance and system efficiency. The designed command area of the scheme is seventy-five (75 ha) but the current irrigated area of the scheme is sixty (60ha) only. To achieve the objectives, primary and secondary data were collected. To gather both primary and secondary data, data-gathering techniques include surveys, interviews, field observations, and meteorological data. Before, during, and after an irrigation event, while farmers were carrying out their regular irrigation practices, several field characteristics were measured and/or observed. These data included the type of crop, irrigation water discharge in the canal, and field size. A survey concerning the availability of water was also carried out among farmers. CROPWAT 8.0 Software was used to organize the crop pattern of the study area along with other relevant data, including soil, climate, rain crop, and crop pattern. Water flow measurement results of the Jato small-scale irrigation scheme at the head, middle, and tail of the lined & unlined main canal were found to be 53.6l/s, 45.4 l/s, and 29.9l/s respectively. The average water flow measurement result of the scheme is 43l/s which reduced from required flow by 18.15l/s. From the analyses of the water balance indicators, the canal conveyance efficiency, canal conveyance loss, application efficiency, and overall efficiency were found to be 70%, 30%, 70%, and 50% respectively. The overall average main canal conveyance efficiency and water conveyance loss were below the recommended values. The studies have shown that the effective infrastructure, irrigation ratio, and water surface elevation ratio of the scheme were found to be 66.7%, 80%, and 66% respectively. However, there were certain areas for improvement identified, such as the need for better coordination among project stakeholders and enhanced maintenance practices to ensure the long-term functionality of irrigation infrastructure.
    
    VL  - 12
    IS  - 2
    ER  - 

    Copy | Download

Author Information
  • Department of Hydraulic and Water Resource Engineering, College of Engineering and Technology, Wallaga University, Nekemte, Ethiopia

  • Department of Hydraulic and Water Resource Engineering, College of Engineering and Technology, Wallaga University, Nekemte, Ethiopia

  • Department of Hydraulic and Water Resource Engineering, College of Engineering and Technology, Wallaga University, Nekemte, Ethiopia

  • Abstract
  • Keywords
  • Document Sections

    1. 1. Introduction
    2. 2. Materials and Methods
    3. 3. Results and Discussions
    4. 4. Conclusions
    5. 5. Recommendations
    Show Full Outline
  • Author Contribution
  • Data Availability
  • Acknowledgements
  • Conflicts of Interest
  • References
  • Cite This Article
  • Author Information