1. Introduction
Climate change is now a scientifically established reality, characterized by a widespread increase in global mean temperatures, an intensification of climate extremes, and disruptions in rainfall regimes
| [1] | IPCC. (2021). Climate Change 2021: The Physical Science Basis. Contribution of Working Group I to the Sixth Assessment Report. Cambridge University Press.
https://doi.org/10.1017/9781009157896 |
[1]
. These phenomena have heterogeneous effects across regions, particularly in West Africa, where ecosystems and socioeconomic systems are highly vulnerable to climate variability and change
. In this context, it is crucial to analyze, at the regional scale, the interactions between key climate variables such as temperature and precipitation to better understand the local dynamics of climate change.
Upper Guinea, a Sudano-Sahelian savanna zone located in the east-central part of the Republic of Guinea, is characterized by a tropical climate with a short and intense rainy season followed by a long dry season. This region plays a central role in the country’s hydrological regulation, hosting the headwaters of several major West African rivers. However, since the 1970s, notable changes in rainfall have been observed, accompanied by a progressive increase in temperatures
| [3] | Sylla, A. (2019). Interannual to decadal variability and response to anthropogenic forcing of the Senegal–Mauritania upwelling system (Doctoral dissertation, Sorbonne University; Cheikh Anta Diop University, Dakar).
https://theses.hal.science/tel-03717699/document |
[3]
. These evolutions raise questions regarding the stability of climatic balances in this region and the potential responses of both the environment and local societies.
The joint study of temperature and precipitation is scientifically justified by their interdependence in atmospheric energy and water budgets. Indeed, rising temperatures can intensify evapotranspiration, alter atmospheric convection, and influence the frequency and intensity of rainfall events
| [4] | Held, I. M., & Soden, B. J. (2006). Robust Responses of the Hydrological Cycle to Global Warming. Journal of Climate, 19(21), 5686–5699. https://doi.org/10.1175/JCLI3990.1 |
[4]
. Conversely, variations in precipitation can modify surface radiative balances, thereby affecting local temperatures. Such bidirectional interactions remain poorly documented at the regional scale in West Africa, particularly in Guinea, underscoring the need for a detailed analysis of their temporal evolution and correlations.
Studies conducted across different African regions confirm a warming trend in minimum temperatures, a key indicator of climate change in tropical zones
| [5] | Diallo, S., Ondoa, H. A., Diallo, S., & Ondoa, H. A. (2025). Climate shocks and the labour market in sub-Saharan Africa: Effects on youth employment and the reallocation of labour supply. International Labour Review, 164(2).
https://doi.org/10.16995/ilr.18840 |
| [6] | Niang, I., Ruppel, O. C., Abdrabo, M. A., Essel, A., Lennard, C., Padgham, J., & Urquhart, P. (2014). Africa. In V. Barros et al. (Eds.), Climate Change 2014: Impacts, Adaptation and Vulnerability (pp. 1199–1265). Cambridge University Press.
https://www.ipcc.ch/site/assets/uploads/2018/02/WGIIAR5-Chap22_FINAL.pdf |
[5, 6]
. In Upper Guinea, this thermal increase is associated with enhanced interannual variability of rainfall, alternating between surplus and deficit years, which complicates the management of agricultural and water resources
| [7] | Padgham, J., Abubakari, A., Ayivor, J., Dietrich, K., Fosu-Mensah, B., Gordon, C.,... & Traore, S. (2015). Vulnerability and adaptation to climate change in the semi-arid regions of West Africa.
https://idl-bnc-idrc.dspacedirect.org/server/api/core/bitstreams/9447d617-6f3c-48f2-80ca-edd3d8c387ce/content |
[7]
. This situation may result from a coupling between regional thermal warming and atmospheric instabilities linked to West African monsoon mechanisms.
Analyzing temperature–precipitation interactions provides an essential basis for calibrating regional climate models (RCMs), particularly those used in climate projections within the CORDEX (COordinated Regional Climate Downscaling EXperiment)-Africa framework
| [8] | Nicholson, S. E. (2013). The West African Sahel: A review of recent studies on the rainfall regime and its interannual variability. International Scholarly Research Notices, 2013(1), 453521. https://doi.org/10.1155/2013/453521 |
[8]
. These models must integrate both natural variability and anthropogenic trends to deliver reliable simulations at the local scale. In this regard, Upper Guinea constitutes a relevant natural laboratory for investigating the combined impacts of global climate forcing and local feedbacks on West African climate systems.
Understanding the links between warming and rainfall instability in Upper Guinea is critical for guiding adaptation strategies, particularly in agriculture, water management, and public health. Farmers, who depend on the timing of rainfall, are directly affected by variations in precipitation and temperature, which influence crop yields and food security
| [9] | Rowell, D. P., Booth, B. B., Nicholson, S. E., & Good, P. (2015). Reconciling past and future rainfall trends over East Africa. Journal of Climate, 28(24), 9768-9788.
https://doi.org/10.1175/JCLI-D-15-0140.1 |
[9]
. A deeper understanding of these interactions would enable better anticipation of seasonal climate risks and help strengthen the resilience of local populations.
This research is distinguished by its integrated approach, combining statistical analysis of climate time series with a physical–climatic perspective on temperature–precipitation interactions. It helps to fill a gap in the regional scientific literature in Guinea, where few studies have simultaneously and comprehensively addressed these two fundamental climate variables
| [4] | Held, I. M., & Soden, B. J. (2006). Robust Responses of the Hydrological Cycle to Global Warming. Journal of Climate, 19(21), 5686–5699. https://doi.org/10.1175/JCLI3990.1 |
[4]
. In this sense, it provides an original and necessary contribution to the understanding of regional climate dynamics in the context of global change.
2. Data and Method
2.1. Study Area
Upper Guinea is one of the four major natural regions of the Republic of Guinea, which is located in West Africa. Located in the eastern part of the country, it extends over a vast, gently undulating savanna plain, favorable to agro-pastoral activities. It is bordered to the north by Mali, to the east by Côte d’Ivoire, to the west by Middle Guinea, and to the south by Forest Guinea.
Administratively, the region comprises eight prefectures (see
Figure 1): Kankan—the regional capital and a significant economic and academic hub—as well as Kérouané, Kouroussa, Mandiana, Siguiri, Dabola, Faranah, and Dinguiraye. These urban centers play a strategic role in economic exchanges, agriculture, mining (particularly gold exploitation in Siguiri and Mandiana), and in the socio-cultural development of the region.
Several strategically essential rivers originate in or cross this region. The most notable is the Niger River, one of the principal hydrographic basins of West Africa, whose source is located in the Faranah area
| [7] | Padgham, J., Abubakari, A., Ayivor, J., Dietrich, K., Fosu-Mensah, B., Gordon, C.,... & Traore, S. (2015). Vulnerability and adaptation to climate change in the semi-arid regions of West Africa.
https://idl-bnc-idrc.dspacedirect.org/server/api/core/bitstreams/9447d617-6f3c-48f2-80ca-edd3d8c387ce/content |
[7]
. These water resources are vital for domestic, agricultural, and pastoral uses.
The climate of Upper Guinea is typical of the Sudano-Sahelian zone, marked by the alternation of a rainy season (from May to October) and a prolonged dry season (from November to April). Average annual rainfall ranges between 900 mm and 1,200 mm, with a peak generally occurring in July or August
| [3] | Sylla, A. (2019). Interannual to decadal variability and response to anthropogenic forcing of the Senegal–Mauritania upwelling system (Doctoral dissertation, Sorbonne University; Cheikh Anta Diop University, Dakar).
https://theses.hal.science/tel-03717699/document |
[3]
. During the dry season, the Harmattan—a dry, dust-laden wind blowing from the northeast—dominates, drastically reducing relative humidity and accentuating the aridity of the climate
| [10] | Janicot, S., Trzaska, S., & Poccard, I. (2001). Summer Sahel-ENSO teleconnection and decadal time scale SST variations. Climate Dynamics, 18(3), 303-320.
https://doi.org/10.1007/s003820100172 |
[10]
. This regime exhibits substantial interannual variability, primarily influenced by fluctuations in the West African monsoon system.
Temperatures are generally high, with annual means exceeding 27°C. The hottest months are March, April, and May, when maximum temperatures can exceed 40°C
| [11] | Luterbacher, J., Dietrich, D., Xoplaki, E., Grosjean, M., & Wanner, H. (2004). European seasonal and annual temperature variability, trends, and extremes since 1500. Science, 303(5663), 1499-1503.
https://doi.org/10.1126/science.1093877 |
[11]
. This combination of intense heat and irregular rainfall is exacerbated by the effects of global climate change, leading to an increased frequency of climate extremes
| [12] | Sultan, B., Defrance, D., & Iizumi, T. (2019). Evidence of crop production losses in West Africa due to historical global warming in two crop models. Scientific reports, 9(1), 12834..
https://doi.org/10.1038/s41598-019-49167-0 |
[12]
. As a result, the regional climate is becoming increasingly unstable, more complex to model, and challenging to predict, with direct implications for ecosystems and livelihoods.
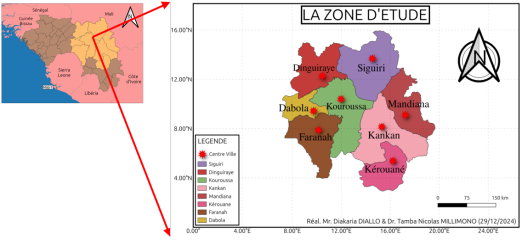
Figure 1. Map of the Upper Guinea Region (Republic of Guinea).
2.2. Data
In this study, we used satellite-based precipitation data from CHIRPS and satellite-based temperature data from CHIRTS (minimum and maximum):
2.2.1. Precipitation Data: CHIRPS
The dataset available at https://data.chc.ucsb.edu/products/CHIRPS-2.0/global_daily/netcdf/p05/ provides daily precipitation data from the CHIRPS product (Climate Hazards Group InfraRed Precipitation with Station data), version 2.0, at a spatial resolution of 0.05° (~5 km). This dataset spans the period from 1981 to the present and integrates in situ observations with satellite infrared data and climatological reanalyzes to produce reliable global precipitation estimates.
CHIRPS is particularly valued for precipitation monitoring in tropical regions with sparse meteorological station coverage, such as Sub-Saharan Africa. In West Africa, where meteorological observations are often limited or discontinuous, CHIRPS serves as a robust alternative for analyzing rainfall trends, characterizing extreme events, and assessing interannual and seasonal rainfall variability
| [13] | Funk, C., Peterson, P., Landsfeld, M., Pedreros, D., Verdin, J., Shukla, S., ... & Michaelsen, J. (2015). The climate hazards infrared precipitation with stations—a new environmental record for monitoring extremes. Scientific data, 2(1), 1-21. https://www.nature.com/articles/sdata201566.pdf |
[13]
.
2.2.2. Temperature Data (Minimum and Maximum)
CHIRTS-daily
The dataset available at https://data.chc.ucsb.edu/products/CHIRTSdaily/v1.0/africa_netcdf_p05/ provides daily temperature data from the CHIRTS-daily product (Climate Hazards InfraRed Temperature with Stations – Daily), version 1.0, also at a spatial resolution of 0.05° for the African continent. CHIRTS combines satellite infrared (IR) observations, historical climatological models (Climate Hazards InfraRed Temperature climatology – CHIRT), and meteorological station records to generate continuous time series of 2-meter air temperature.
This product enables high-resolution monitoring of thermal trends, particularly in regions exposed to significant thermal stress such as the Sahel and Upper Guinea. It is especially well suited for analyzing heat extremes, heatwaves, and studying the impacts of climate warming on ecosystems and human activities
| [14] | DIALLO, D., MILLIMONO, T. N., BEAVOGUI, M., DIABY, I., DIALLO, A. K., & SAKOUVOGUI, A. Diachronic analysis of the evolution of climatic parameters and land use in Kintignan-Siguiri (Republic of Guinea). |
[14]
. CHIRTS represents an essential complement to CHIRPS for interdisciplinary research linking temperature and rainfall to issues of food security, health, and climate adaptation.
The integration of CHIRPS (precipitation) and CHIRTS (temperature) datasets provides a robust framework for analyzing regional climate dynamics, particularly in areas highly exposed to climate hazards such as Upper Guinea.
2.3. Methods
2.3.1. Monthly Climatology
The descriptive approach involved calculating 30-year climatological monthly averages for each analyzed climate variable, namely precipitation, minimum temperature (Tmin), and maximum temperature (Tmax). These averages were subsequently used to construct ombrothermic-type climate graphs to illustrate the characteristic annual cycles of each parameter. This graphical representation facilitates the visualization of local climate seasons and periods marked by overlap or offset between heat and humidity.
From an interpretative perspective, these annual cycles were related to major regional atmospheric mechanisms. The analysis notably considered the position of the Intertropical Convergence Zone (ITCZ), trade wind circulation, and the dynamics of the West African monsoon. This approach enables a better understanding of the climatic factors governing the seasonal distribution of temperature and precipitation.
2.3.2. Interannual Analysis
The interannual analysis began with the calculation of annual precipitation totals and annual means of Tmin and Tmax for each year of the study period. The resulting time series were then standardized by computing standardized anomalies (Z-scores) using the formula Z=(X−μ)/σ, where X is the annual value, μ is the mean, and σ is the standard deviation over the period. These anomalies were represented as bar charts to facilitate visual interpretation.
To assess the temporal evolution of climate parameters, a trend analysis was performed using a simple linear regression of the form Y=aX+b, where Y represents the studied variable (standardized anomaly) and X the corresponding year. The obtained slope allowed estimation of the direction and magnitude of the trend, while its significance was tested using the Student’s t-test p-value, with a significance threshold of 5%.
2.3.3. Correlation Analysis
Correlation analysis was based on the computation of Pearson’s linear correlation coefficients (r) to study the relationships between different climate variables. Three variable pairs were examined: Tmin vs. Tmax, precipitation vs. Tmax, and precipitation vs. Tmin. These correlations were visualized using a correlation matrix and scatter plots with regression lines, allowing the assessment of potential linear relationships between the parameters.
Finally, the statistical significance of the obtained correlations was evaluated using a p-value with a threshold set at 0.05. This step allowed identification of significant links between the analyzed climate variables and improved the understanding of thermal and rainfall interactions in the study context.
This work is organized as follows: Section 1 provides a general introduction to the topic. Section 2 presents the study area, details the datasets used, and describes the methodology applied for the analyses. Section 3 presents the obtained results, accompanied by interpretation and discussion. Finally, Section 4 offers a general conclusion, highlighting the main findings of the study and outlining potential directions for future research.
3. Results & Discussion
3.1. Results
3.1.1. Monthly Climatology of Precipitation, Minimum and Maximum Temperature
Figure 2 clearly illustrates the synchronization of climate variations in Upper Guinea, highlighting the monthly relationships between thermal regimes and precipitation. A well-defined rainy season extends from May to October, with a peak in August when rainfall reaches nearly 350 mm. This wet phase is directly linked to the seasonal northward migration of the Intertropical Convergence Zone (ITCZ), which drives the influx of humid maritime air from the Gulf of Guinea. In contrast, the period from November to April is almost arid, characterized by very low or negligible rainfall. This seasonal cycle directly shapes the thermal behavior of the region.
During the dry season, temperatures reach particularly high levels due to atmospheric stability, low humidity, and intense solar radiation. Maximum temperatures peak in April–May at around 38°C, just before the onset of the rains. With the establishment of the wet season, a sharp cooling occurs: maximum temperatures drop to about 29°C in August, at the height of the rainy season. Minimum temperatures follow a similar but more moderate trend, peaking at approximately 26°C in May–June, then gradually declining to about 19°C in December–January, the coolest period of the year.
This parallel dynamic between temperature and precipitation underscores their interdependence. During the rainy season, abundant rainfall induces a general cooling effect, resulting from the combined influences of dense cloud cover, enhanced evaporation, and reduced solar radiation. Conversely, during the dry season, the absence of rainfall allows for intense daytime heating, while clear skies at night promote significant cooling, thereby amplifying the diurnal temperature range. These mechanisms reveal the high sensitivity of the local climate to seasonal variations in atmospheric conditions.
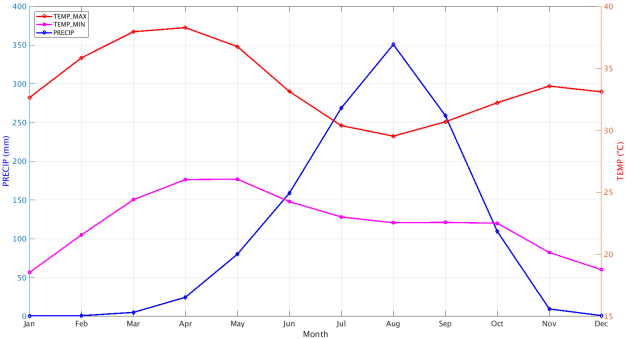
Figure 2. Monthly evolution of precipitation (mm), maximum temperature (TEMP_MAX,°C), and minimum temperature (TEMP_MIN,°C) throughout the year. Precipitation is plotted on the left vertical axis (blue). At the same time, while temperatures are plotted on the right vertical axis, with maximum temperatures shown in red and minimum temperatures shown in magenta.
3.1.2. Annual Mean of Precipitation, Minimum and Maximum Temperature
Figure 3 shows substantial interannual variability in precipitation. Following a moderately wet phase at the end of the 1980s, an exceptional peak occurred in 1994, with rainfall exceeding 1,500 mm. This maximum was followed by a sharp decline between 1995 and 1997, and a second low at the beginning of the 2000s, reaching a minimum of around 1,100 mm in 2004. The last decade shows a gradual recovery, with notable peaks in 2011, 2013, and especially 2015. However, the linear trend in precipitation (+3.7 mm/year) remains statistically non-significant (p = 0.102), confirming that variability dominates the long-term rainfall signal in this transitional Sahelian region.
Maximum and minimum temperatures respond in concert but with different amplitudes. Tmax ranges between approximately 32.8°C and 34.8°C: the highest values occur during dry years (1987, 2000, 2004, 2011), whereas the lowest values coincide with the rainfall peaks of 1994 and 2015. Tmin follows a similar pattern, oscillating between ~21.5°C and 23.7°C; 2005 recorded the warmest nights of the decade, while 1994 and 2008 were comparatively cooler. When these two series are considered together, a slight upward shift of about +0.03°C per year is evident, indicating a gradual warming of the regional thermal baseline despite short-term fluctuations.
The wettest season corresponding to the coolest season likely indicates a coupling between the two systems and may be caused by an increase in cloud cover during this period. Water vapor, being a greenhouse gas, tends to raise the temperature, and evaporation can also contribute to warming. Conversely, rainfall deficits release the atmosphere from these thermal constraints: maximum insolation elevates Tmax, and low humidity limits nocturnal heat retention, keeping Tmin relatively high. This inverse behavior suggests a notable negative correlation between precipitation and temperature, a phenomenon already highlighted in his studies on West African monsoon dynamics, where he noted that periods of heavy rainfall are generally accompanied by regional cooling due to increased cloud cover and reduced direct insolation.
For Upper Guinea, this implies that drought years amplify thermal stress, affecting crop evapotranspirative demand, whereas wet years moderate the climate but increase flood risk. Understanding this co-variability is therefore essential for adjusting agricultural calendars, anticipating water shortages, and refining seasonal climate forecasts.
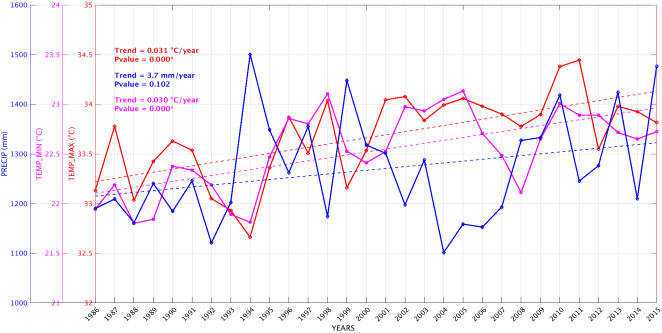
Figure 3. Annual evolution of three key climate variables in Upper Guinea from 1986 to 2015: precipitation (blue line, scale 1000–1600 mm on the left axis), mean minimum temperature (magenta line, 21–24°C on the left inner axis), and mean maximum temperature (red line, 32–35°C on the right axis).
3.1.3. Evolution of Trends in Precipitation, Minimum and Maximum Temperature
The figure presents the interannual evolution of standardized anomalies of precipitation (
Figure 4a) as well as minimum (
Figure 4b) and maximum temperatures (
Figure 4c) in Upper Guinea (UG) over the period 1986–2015. Each graph shows a linear trend (black dashed line) and the statistical significance of this trend via the p-value. Red bars represent positive anomalies (above the mean), while blue bars indicate negative anomalies (below the mean). The objective is to highlight climate fluctuations as well as the direction and magnitude of climate trends over three decades.
Figure 4a shows the standardized precipitation anomalies. Strong interannual variability is observed, with an irregular alternation of wet and dry periods. The year 1994 recorded a strong positive anomaly, followed by a sharp deficit from 1995 to 1997, and a second notable deficit in the early 2000s. Several sporadic surpluses are also observed (2011, 2013, 2015). The linear trend is slightly positive (trend = 0.0346), suggesting a moderate increase in precipitation; however, the p-value (0.1083) indicates that this trend is not statistically significant at the 5% level. This implies that rainfall is largely dominated by interannual variability, without a clear trend toward wetting or drying.
Figure 4b illustrates the standardized anomalies of minimum temperatures (Tmin). A significant increase in positive anomalies is observed from the 2000s onward, with very few years below the mean during the second half of the period. Trend analysis (trend = 0.0720) reveals a pronounced increase in Tmin, which is statistically significant (p = 0.0013). This indicates a clear and consistent nocturnal warming in Upper Guinea over the past thirty years, potentially affecting crop biological cycles and soil moisture retention.
Figure 4c shows the standardized anomalies of maximum temperatures (Tmax), which also display a markedly positive trend (trend = 0.0725) with a very low p-value (0.0017), confirming a significant increase in daytime temperatures. The curve indicates a gradual transition from cooler years (before 2000) to predominantly warm years from 2001 onward, with pronounced peaks around 2010–2013. This sustained daytime warming, combined with nocturnal warming, reflects a generalized thermal shift in the region.
Comparing the three series, minimum and maximum temperatures show much stronger and statistically significant trends than precipitation. While rainfall does not exhibit a significant change, temperatures show a clear upward trajectory throughout the period. This suggests that, even in the absence of a widespread decline in precipitation, climate warming is already well established in the region, altering thermal conditions with hydrological, agricultural, and health implications.
Temperatures are increasing significantly, while precipitation remains highly variable without a clear trend. This co-evolution has important consequences: on one hand, increasing Tmax enhances evapotranspiration, while rising Tmin limits nocturnal cooling, intensifying thermal stress; on the other hand, rainfall instability complicates agricultural planning. These findings underscore the need to strengthen climate monitoring, adapt seasonal forecasting systems, and promote agricultural adaptation strategies in Upper Guinea.
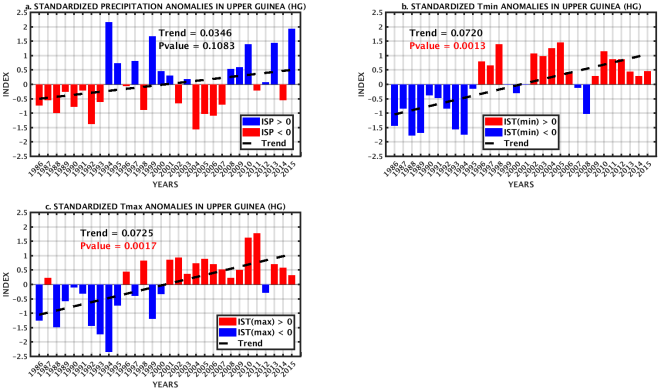
Figure 4. Interannual evolution of standardized anomalies of precipitation (a), minimum temperature (b), and maximum temperature (c) in Upper Guinea (UG) over the period 1986–2015. Each graph shows a linear trend (black dashed line) and the statistical significance of this trend via the p-value. Red bars represent positive anomalies (above the mean), while blue bars indicate negative anomalies (below the mean). The objective is to highlight climate fluctuations as well as the direction and magnitude of climate trends over three decades.
3.1.4. Correlation Matrix Between Precipitation, Maximum and Minimum Temperature
The first observation is the relatively strong and positive correlation (r = 0.78) between TEMP (MAX) and TEMP (MIN). This indicates that when the maximum temperature rises, the minimum temperature also tends to increase, which is consistent with a climate where daily temperatures vary in a relatively synchronized manner. The regression line shows a clear upward slope, reflecting a strong linear relationship between these two variables.
In contrast, the correlations between temperatures (TEMP (MAX) and TEMP (MIN)) and precipitation (PRECIP) are weak or negligible: r = -0.11 between PRECIP and TEMP (MAX), and r = -0.02 between PRECIP and TEMP (MIN). This indicates the absence of a significant linear relationship between rainfall amounts and daily temperatures in this data sample. The scatter plots are highly dispersed, showing no apparent structure, and the regression lines are nearly horizontal, confirming this lack of trend.
From a scientific perspective, these results suggest that maximum or minimum temperatures do not directly influence precipitation in this specific case, or that other climatic factors (humidity, atmospheric circulation, winds, oceanic phenomena) play a more dominant role in precipitation variability. This information is crucial for climate modeling and for studying the impacts of climate change on rainfall patterns.
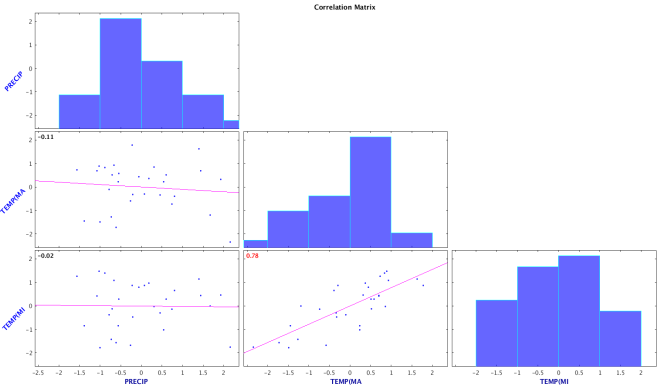
Figure 5. Cross-correlation matrix between three climate variables: precipitation (PRECIP), maximum temperature (TEMP (MAX)), and minimum temperature (TEMP (MIN)). The histograms along the diagonal show the statistical distribution of each variable (frequency of their standardized values), while the plots below the diagonal display scatter plots with linear regression lines, including Pearson correlation coefficients when statistically significant.
3.2. Discussion
In Upper Guinea, the concurrent increase in precipitation, maximum, and minimum temperatures observed over the period 1986–2015 highlights a marked co-variability between the thermal and hydric components of the regional climate. This evolution reflects an intensification of the interactions between temperature and atmospheric humidity. The moderating effect of cloud cover on solar radiation, as identified by New, M.
| [15] | New, M., Hewitson, B., Stephenson, D. B., Tsiga, A., Kruger, A., Manhique, A.,... & Lajoie, R. (2006). Evidence of trends in daily climate extremes over southern and west Africa. Journal of Geophysical Research: Atmospheres, 111(D14).
https://doi.org/10.1029/2005JD006289 |
[15]
and Verdin, A.
| [16] | Verdin, A., Funk, C., Peterson, P., Landsfeld, M., Tuholske, C., & Grace, K. (2020). Development and validation of the CHIRTS-daily quasi-global high-resolution daily temperature data set. Scientific Data, 7(1), 303. https://www.nature.com/articles/s41597-020-00643-7.pdf |
[16]
, remains relevant for explaining certain intra-seasonal variations. Still, long-term trends indicate a more complex dynamic dominated by global warming and an intensified hydrological cycle.
The significant increase in precipitation, although punctuated by deficit periods (notably between 2000 and 2004) and extreme peaks (1994, 2015), marks a departure from the severe drought periods observed in previous decades. This rainfall signal aligns with the recovery documented at the Sahelian and Sudanian scales, partly attributed to decadal variability in the tropical Atlantic and favorable phases of the
AMO (Atlantic Multidecadal Oscillation) and ENSO (El Niño-Southern Oscillation) are associated with positive or negative rainfall anomalies, thereby modulating the intensity and distribution of the observed precipitation
| [10] | Janicot, S., Trzaska, S., & Poccard, I. (2001). Summer Sahel-ENSO teleconnection and decadal time scale SST variations. Climate Dynamics, 18(3), 303-320.
https://doi.org/10.1007/s003820100172 |
| [17] | Nikulin, G., Jones, C., Giorgi, F., Asrar, G., Büchner, M., Cerezo-Mota, R.,... & Sushama, L. (2012). Precipitation climatology in an ensemble of CORDEX-Africa regional climate simulations. Journal of Climate, 25(18), 6057-6078.
https://doi.org/10.1175/JCLI-D-11-00375.1 |
[10, 17]
.
Simultaneously, minimum and maximum temperatures have experienced sustained warming, with an average increase of approximately +0.03°C per year. This trend is consistent with regional observations reported by IPCC.
| [1] | IPCC. (2021). Climate Change 2021: The Physical Science Basis. Contribution of Working Group I to the Sixth Assessment Report. Cambridge University Press.
https://doi.org/10.1017/9781009157896 |
[1]
and analyses by Gyamfi, C.
| [18] | Gyamfi, C., Amaning-Adjei, K., Anornu, G. K., Ndambuki, J. M., & Odai, S. N. (2019). Evolutional characteristics of hydro-meteorological drought studied using standardized indices and wavelet analysis. Modeling Earth Systems and Environment, 5(2), 455-469. https://doi.org/10.1029/2005JD006290 |
[18]
, which show a notable rise in temperatures, particularly nocturnal, across West Africa. The rise in minimum temperatures is a major concern for agriculture, as it disrupts nocturnal cooling necessary for certain crops and increases thermal stress, negatively affecting crop yields
| [19] | Konaté, M., Ahmed, Y., Gärtner, A., Amadou, D. A., Maharou, H. I., Tourba, K.,... & Linnemann, U. (2018). U–Pb detrital zircon ages of sediments from the Firgoun and Niamey areas (eastern border of West African Craton, West Niger). Comptes Rendus. Géoscience, 350(6), 267-278.
https://doi.org/10.1016/j.crte.2018.06.005 |
[19]
.
The strong correlation between maximum and minimum temperatures (r = 0.78) suggests a common thermal forcing, likely radiative in origin or linked to atmospheric feedback mechanisms. Conversely, the absence of significant linear correlation between temperatures and precipitation highlights a relative decoupling of long-term control processes, as suggested by Bitton, J.
| [20] | Bitton, J. (2019). Multi-scale analysis of the evolution of sensible and latent heat fluxes exchanged between a forest ecosystem and the atmosphere using the continuous wavelet transform. http://hdl.handle.net/2268.2/7698 |
[20]
. This complexity complicates the understanding and prediction of climate impacts on agro-ecological systems.
In Upper Guinea, this triple increase (precipitation, minimum and maximum temperatures) results in higher potential evapotranspiration, altering water balances and exacerbating crop thermal stress. These changes underscore the need for climate adaptation measures, including adjustments to agricultural calendars, diversification of cropping systems, and strengthening the resilience of rural populations, in line with recommendations by Sultan, B., & Gaetani, M.
| [21] | Sultan, B., & Gaetani, M. (2016). Agriculture in West Africa in the twenty-first century: climate change and impacts scenarios, and potential for adaptation. Frontiers in plant science, 7, 1262. https://doi.org/10.3389/fpls.2016.01262 |
[21]
.
4. Conclusion
The joint analysis of thermal and precipitation regimes in Upper Guinea reveals a marked climatic seasonality, characterized by a strong dependence of temperatures on rainfall cycles. From May to October, the rainy season, dominated by the northward migration of the ITCZ and the influx of humid air from the Gulf of Guinea, peaks in August with nearly 350 mm of precipitation. Conversely, from November to April, a quasi-arid dry season sets in, with maximum temperatures reaching approximately 38.5°C in April–May. The onset of rainfall leads to a significant drop in temperatures, reaching a minimum of about 29°C in August, while minimum temperatures fluctuate between 26°C in May–June and 19°C in December–January. This interdependence between temperature and precipitation reflects the strong sensitivity of the local climate to seasonal variations, where cloud cover, humidity, and insolation play a determining role in regional thermal modulation.
At the interannual scale, data indicate high rainfall variability, without a significant linear trend over the 1986–2015 period, despite notable anomalies such as the surpluses in 1994 and 2015 or the deficits in the early 2000s. In contrast, minimum and maximum temperatures show a significant and continuous increase, estimated at about +0.03°C per year, consistent with global trends observed in Europe
| [11] | Luterbacher, J., Dietrich, D., Xoplaki, E., Grosjean, M., & Wanner, H. (2004). European seasonal and annual temperature variability, trends, and extremes since 1500. Science, 303(5663), 1499-1503.
https://doi.org/10.1126/science.1093877 |
[11]
. This thermal rise (particularly of nocturnal temperatures) constitutes a strong signal of regional climate warming, with profound implications for agro-ecological balances, water demand, and population living conditions.
The study of standardized anomalies and correlations reveals that temperatures evolve in a more structured and significant manner than precipitation, indicating a climate dynamic dominated by warming, even in the absence of marked aridification. The strong correlation between Tmax and Tmin (r = 0.78) indicates daily thermal homogenization, while the weak correlation between temperatures and precipitation suggests a growing disconnect between these variables, possibly amplified by exogenous factors such as oceanic variability, regional atmospheric circulation, and land-use changes. These findings highlight the complexity of climatic interactions in Upper Guinea, where the climate system’s response to global forcings remains partially non-linear
| [11] | Luterbacher, J., Dietrich, D., Xoplaki, E., Grosjean, M., & Wanner, H. (2004). European seasonal and annual temperature variability, trends, and extremes since 1500. Science, 303(5663), 1499-1503.
https://doi.org/10.1126/science.1093877 |
[11]
.
Overall, this study emphasizes the urgency of integrating climate co-variability into local adaptation strategies. The sustained rise in temperatures, combined with unpredictable rainfall, necessitates the revision of agricultural calendars, strengthening of seasonal climate forecasting capacities, and improved water resource management. Further research on the atmospheric and oceanic mechanisms underlying these dynamics is also essential to enhance understanding of the processes governing regional climate. In Upper Guinea, as in the rest of West Africa, climate resilience will require better anticipation of risks and climate governance based on robust and context-specific data.
Author Contributions
Diakaria Diallo: Conceptualization, Formal Analysis, Methodology, Supervision, Project Administration, Validation, Writing – original draft, Writing – review & editing
Moussa Mamady Traore: Conceptualization, Data curation, Formal Analysis, Methodology, Software, Validation, Visualization, Writing – original draft, Writing – review & editing
Tamba Nicolas Millimono: Conceptualization, Formal Analysis, Project Administration, Supervision, Validation, Writing – original draft, Writing – review & editing
Mamadou Keita: Supervision, Validation, Writing – original draft
Hambaliou Balde: Project Administration, Validation, Writing – original draft
Bakary Traore: Methodology, Data Curation, Software, Validation, Writing – original draft
Abdoulaye Banire Diallo: Validation, Writing – original draft
Maoro Beavogui: Validation, Writing – original draft
Ibrahima Kalil Kante: Formal Analysis, Validation, Writing – original draft, Writing – review & editing
Idrissa Diaby: Writing – original draft, Validation