Research Article | | Peer-Reviewed

Design, Synthesis, and Characterization of Ag@CeO2 Nanoparticles: Tuning Their Structural, Optical, and Morphological Properties via Sol–Gel Method

Received: 14 August 2026     Accepted: 25 August 2026     Published: 18 September 2026
Views:       Downloads:
Abstract

The present study give information about Ag-doped cerium dioxide (Ag@CeO2) nanoparticles (Agx Ce1-x O2, where x = 0, 0.02, 0.04, and 0.06 molar ratios, corresponding to 0, 2, 4, and 6 mol% Ag) that were synthesized via a cost-effective and novel sol-gel method. Pure and Ag-doped CeO2 samples with varying dopant concentrations were prepared to evaluate the influence of Ag-doping on the fluorite cubic structure of ceria. Characterization Techniques like X-ray diffraction analysis confirmed the phase change from amorphous to face centered cube (FCC) in Ag@CeO2 and crystallite size from 19.29 nm for pure CeO2 to 18.70 nm for Ag-doped CeO2, as calculated using the Scherrer equation. Scanning Electron Microscopy analysis revealed the non-uniform and irregular surface morphology of Ag@CeO2 NPs using SEM micrograph. notable red shift in the absorption edge, corresponding to a bandgap (Eg) narrowing from ~ 3.2 eV down to ~ 2.7 eV with increasing silver concentration. Scanning electron microscopy (SEM) and transmission electron microscopy (TEM) analysis’s showed significant morphological changes, transitioning from uniform spherical grains to agglomerated nanostructures with enhanced surface-to-volume ratios. UV-Visible analysis conformed Fourier-transform infrared (FTIR) spectroscopy, which further validated the formation of Ce-O and Ag-O vibrational modes. Energy-dispersive X-ray spectroscopy (EDX) verified elemental composition and weight percentage distributions. The enhanced optical response and tailored nanostructure make these Ag-CeO2 nanoparticles highly promising candidates for optoelectronic devices, photocatalytic degradation, and biomedical applications.

Published in American Journal of Materials Synthesis and Processing (Volume 11, Issue 2)
DOI 10.11648/j.ajmsp.20261102.11
Page(s) 38-51
Creative Commons

This is an Open Access article, distributed under the terms of the Creative Commons Attribution 4.0 International License (http://creativecommons.org/licenses/by/4.0/), which permits unrestricted use, distribution and reproduction in any medium or format, provided the original work is properly cited.

Copyright

Copyright © The Author(s), 2026. Published by Science Publishing Group

Keywords

Ag@CeO2) NPs, Cerium Dioxide, Morphological Properties, Ag-doped, Materials Characterizations

1. Introduction
Cerium oxide (CeO2) has attracted considerable attention as a multifunctional metal oxide because of its excellent chemical stability, high oxygen storage capacity, remarkable redox behavior, and wide range of technological applications . Owing to its fluorite crystal structure and the reversible Ce3+/Ce4+ redox couple, CeO2 exhibits unique structural, optical, catalytic, and electronic properties, making it a promising material for photocatalysis, sensors, energy conversion, environmental remediation, and optoelectronic devices . However, the relatively wide band gap and rapid recombination of photogenerated electron-hole pairs limit the performance of pristine CeO2 in several practical applications .
Several strategies have been employed to improve the physicochemical properties of CeO2 nanoparticles, among which metal-ion doping is one of the most effective approaches . Silver (Ag) is a suitable dopant because it can modify the crystal structure, reduce crystallite size, enhance visible-light absorption, and improve charge-carrier separation . Thus, Ag dopening significantly influences the structural, optical, and morphological characteristics of CeO2, leading to enhanced functional performance .
This synthesis method plays an important role in determining the particle size, morphology, crystallinity, and optical properties of nanoparticles . Among the various synthesis techniques, the sol-gel method offers several advantages, including simplicity, low processing temperature, high purity, excellent compositional homogeneity, and precise control over particle size and morphology . These features make the sol-gel route particularly suitable for synthesizing uniformly dispersed Ag-doped CeO2 nanoparticles . The structural, morphological, elemental, and optical properties of the synthesized nanoparticles were characterized using X-ray diffraction (XRD), scanning electron microscopy (SEM), energy-dispersive X-ray spectroscopy (EDX), Fourier transform infrared (FTIR) spectroscopy, and UV–Visible spectroscopy . The present study focuses on the synthesis of Ag-doped CeO2 (Ag@CeO2) nanoparticles via the sol-gel method and the systematic investigation of their physicochemical properties . Finally, the optical performance of the prepared nanomaterials was evaluated to assess the influence of Ag-doping on the functional properties of CeO2 nanoparticles .
2. Experimental Procedure
2.1. Materials and Method
Conversely, substance strategies provide a simple and versatile option for the nanostructure of readiness due to lower union temperature and higher atom uniformity; some of these substances' processes call for a longer reaction time, a higher pressing factor, and several handling operations, as well as a higher growth temperature (more than 100°C). Other synthetic approaches use surfactants and other chemicals to match the form and size of nanostructures, which introduce impurities into the ideal product.
The following chemicals were used.
1) Silver Nitrate (AgNO3)
2) Acetic Acid (CroH9NO2)
3) Sodium hydroxide (NaOH)
4) DI water (H2O)
5) Cerium (IV) Sulfate tetrahydrate (Ce(SO4)2.4H2O).
Table 1. Molecular weight of materials used in research work.

Compound

Molecular waight(g)

Silver Nitrate

169.87

Acetic acid

60.052

Sodium hydroxide

39.99

DI water

18.015

Cerium (IV) Sulfate tetrahydrate

404.3

2.1.1. Silver Nitrate
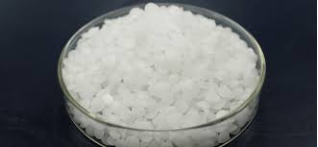
Silver nitrate (AgNO3) is a colorless solid. When it comes into contact with light or any biological material, it turns black. AgNO3 (Silver nitrate) can be made by dissolving silver in nitric acid and then evaporating the solution. The cation of silver (Ag) and anion of nitrate (NO3) form an ionic bond. Because of its ionic nature, this chemical disperses readily in water and breaks down into its component ions. The stoichiometry of the process is determined by the nitric acid concentration used. X-ray crystallography has been applied to analyze the composition of silver nitrate multiple times. Silver nitrate is a caustic chemical compound used as an antiseptic, to prepare other silver salts in industry, and as a reagent in analytical chemistry. AgNO3 is its chemical formula. In its solid state, a trigonal arrangement of AgNO3 is used. It is often used as a base for other substances containing silver.
Figure 1. Silver Nitrate.
2.1.2. Uses of Silver Nitrate
In addition to being used to create photographic films, it is also used in the lab as a stain to make proteins visible in PAGE gels or scan imaging techniques. AgNO3 is a caustic chemical compound used as an antiseptic, in the production of various silver salts in industry, and as a reagent in analytical methods. Photography, mirrors, inks, chemical analysis, silver plating, and dyes all require silver nitrate.
Table 2. Properties of Silver Nitrate.

Properties

Silver Nitrate

The molecular weight of AgNO3

169.87 g/mol

Density of silver Nitrate

4.35g/cm3

Melting point of AgNO3

212°C

Boiling point of AgNO3

440°C

2.1.3. Acetic Acid
Acetic acid is an organic liquid that is transparent, colorless, and has a pungent odor similar to household vinegar. The bulk of acetic acid is produced through methanol catalytic oxidation, in which methanol & carbon monoxide mix to make acetic acid. The substance is miscible with CHOH, CHCOCH3, and ethyl ether benzene and dissolves in CCL, and carbon disulfide. The chemical formula for acetic acid is CH3COOH. It is used as a raw material and solvent in the manufacture of oil, gas, pharmaceutical, and food industries. It can be mixed in any quantity with water, alcohol, or ether. Acetic acid, like ethanol is a hydrophilic solvent. It dissolves oils, sulfur, iodine, and mixes them with water, hexane, and chloroform. It forms crystals that look similar to ice at temperatures below 16.6°C. It can be used for a variety of purposes because it is a polar, strong acid solvent. Glacial CH3COOH is frequently employed in analytical chemistry to evaluate weakly alkaline substances. Acetic acid is a particularly essential industrial solvent because of its favorable solvent characteristics and ability to generate miscible mixes with both polar and non-polar chemicals. It is commonly utilized in the production of dimethyl terephthalate (DMT).
Figure 2. Acetic Acid.
2.1.4. Sodium Hydroxide
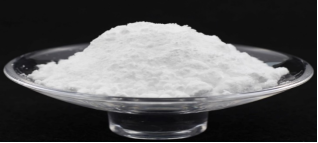
The corrosive white crystalline solid sodium hydroxide (NaOH), often known as caustic soda or lye, contains the Na (sodium) cation and the OH (hydroxide) anion. It fascinates water quickly till it dissolves. It has no smell. Water, glycerol, and ethanol are all soluble in it. An exothermic reaction occurs when solid sodium hydroxide is combined with water. PH stands for Potential of Hydrogen in its entire form. The concentration of hydrogen ions in a solution is known as pH, and it is used to determine whether a solution is acidic or basic. Some household cleaners, such as drain cleaners and oven cleaners, contain sodium hydroxide. NaOH is one of the most basic hydroxides and is widely used to explain the pH scale to chemistry students, alongside neutral water and acidic hydrochloric acid.
Figure 3. Sodium Hydroxide.
2.1.5. Deionized Water
The most basic definition of deionization is the method of removing ions (charged particles) from water. Typically, an ion-exchange medium is used in this process, which draws charged mineral ions and substitutes them with ions that eventually combine to form water. DI grade water is filtered water that has almost all of its mineral ions removed, including cations such as calcium, iron, NaCl, and Cu, as well as anions such as Cl and sulfate. Most contaminants are removed from distilled water by boiling it until it evaporates and then re-condenses. The DI method makes use of ion-exchange resins that trade hydrogen as well as hydroxyl ions for dissolved minerals, then recombine to produce water (H2O).
2.1.6. Cerium (IV) Sulfate
Cerium (IV) oxide is a rare-earth metal oxide also identified as ceric dioxide, ceric oxide, cerium oxide, ceria, or cerium dioxide. CeO2 is a chemical compound with a pale yellow-white precipitate. It serves as both a crucial stage in the extraction of the metal from its ores and a commercially valuable byproduct. Ce (SO4)2 is the anhydrous salt, whereas Ce (SO4)2. (H2O) is the hydrated version, with x equal to 4, 8, or 12. These salts are solids that range in color from yellow to yellow-orange and are mildly soluble in water and dilute acids.
Figure 4. Cerium Sulfate.
2.1.7. Properties of Cerium Sulfate
1) The molecular weight of Ce(SO4)2 332.24 g/mol.
2) The density of Cerium sulfate is 3.91 g/cm.
3) The melting point of Cerium sulfate is 350°C.
4) Its Appearance is Yellow-orange crystal (tetrahydrate).
2.2. Apparatus
The apparatus used in the research work was: Beakers (to make different solutions)
1) Electronic Balance
2) Magnetic Stirrer
3) Centrifuge Machine
4) Aluminum Foil
5) Spatula
6) Dropper
7) Oven
8) Furnace
9) China Dish
2.2.1. Electronic Balance
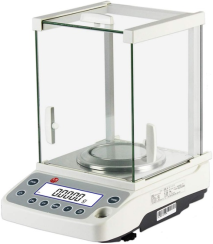
Balances do not precisely observe mass; rather, they gauge the weight dropped downward pressure on the balancing pan. This weight is measured using an electromagnet because the majority of measurement equipment uses electromagnetic balancing. The force generated by the electromagnetic servomotor counteracts the weight of the mass being recorded. After that, the mass is displayed on the screen. Many balances contain a "null detector" that employs a light source and detector to indicate when the weight and electromagnetic forces are equivalent. Analytical balances and precision balances with readabilities of 0.001 g, 0.01 g, and 0.0001 g are some of the most frequently used balances in labs today. A plastic enclosure, a stainless steel frame, an LCD and weighing pan (in the case of an electronic balance), and a glass draught shield are the most common components of a laboratory balance. Research labs, clinical laboratories, industrial settings, production academic settings, and environmental settings are among places where laboratory balances can be used. Digital balances have greatly reduced or eliminated the possibility of human error. Simplified the device's functioning and reduced weighing times. A digital balance has the disadvantage of requiring electricity to operate. Today's lab balances and scales come in a variety of designs and sizes. A balance is an essential piece of equipment in every research facility. Generally, laboratory balances are used to determine the weight or mass of an object with extreme precision.
Figure 5. Electronic Balance.
2.2.2. Beakers
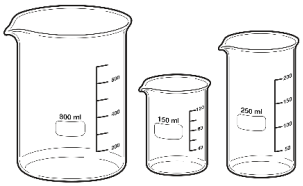
A large, cylindrical glass container with such a pouring lip is commonly used in laboratories. Because of their conical shape, these beakers are also known as conical or titration beakers. Emil Erlenmeyer, a German chemist, gave them their name. Laboratory beakers are containers in which liquid can be swirled, combined, or heated. Depending on the objectives, they come in different sizes, materials, and shapes, and they can be reusable or disposable.
The cylindrical beaker, typically made of borosilicate, the flat bottom, beaded rim or lip, and the little spout in the shape of a beak are all telltale indications of the beaker. These are the most common and are employed for a variety of tasks, including making solutions and filtering supernatant fluids, holding waste fluids before disposal, and executing simple reactions. When performing a chemical experiment, low-form beakers are likely to be employed in some fashion. These are the most common and are employed for a variety of tasks, including making solutions and performing simple processes, storing waste fluids before removal, and handling supernatant fluid. When performing a chemical experiment, Low-form beakers will probably be employed in a certain manner.
2.2.3. Magnetic Stirrer
A magnetic stirrer, which generates a rotating magnetic field, is frequently employed in lab settings. It is made up of an electromagnet that is either fixed or rotating. This tool could be used, for instance, to quickly spin, dip in a liquid, make a stir bar, and stir or combine a solution. To warm the liquid, a magnetic stirring system is typically used in conjunction with a connected heat pump. In many contemporary magnetic stirrers, an electric motor rotates the magnets. This is one of the simplest pieces of mixing equipment to operate. Because they are silent, magnetic stirrers may agitate closed systems.
A magnetic rod that is placed into the solution and stirred is the basis of magnetic stirring. Alternative revolving or assembly of the stirrer's electromagnets beneath the liquid-filled container drives the stirring bar's movement. Magnetic or mechanical spinning is ineffective in dispersing NPs on its own. This method has been used to disperse nanotubes. However, it is usually employed in conjunction with other, more effective dispersion methods, such as sonication. Bar-shaped electromagnetic stirrers typically have an octagon or round cross-section, though there is a range of unusual shapes available for more efficient stirring. Numerous stir sticks have an axle circle that rotates everywhere in the center. The highest fluid temperature that can be reached is determined by the flask size, the amount of solution to be heated, the heating element's power, and the amount of insulation provided to the device. To avoid interference with the magnetic field, these stirrers must be used in glassware or other non- metal beakers.
Figure 7. Magnetic Stirrer.
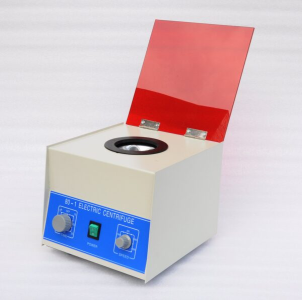
2.2.4. Centrifuge Machine
A method of numerically integrating the Navier-Stokes equations is presented for axisymmetric compressible flows. A modified Newton's method is employed to determine the steady motion of gas in a rotating cylinder without the use of a time-consuming marching process with respect to time. A suitable form of the finite difference equations gives a computationally stable integration with reasonable representation of the spatial characteristics of the flow. The method includes a Gaussian elimination procedure which consists of the transformation of the Jacobian matrix to a triangular matrix followed by backward substitution. By using an auxiliary constant matrix algorithm, the method gives the solution within reasonably acceptable computation time.
As an example of the method, some features of solutions are presented for the steady flow of UF6 gas in the centrifuges, which have openings for feed and withdrawal on the end plates of centrifugation; two substances in a solution can be separated from one another. During this whole process, the heavier element of the mix migrates away from the middle, whereas the lighter portion migrates toward the axis. A centrifuge works on the sedimentation theory, which states that liquids segregate according to density under the effect of gravity (g-force). Isopycnic, the gradient of mass, phase separation, ultrafiltration, and pelleting are examples of separation methods. The constituents of various mixtures are separated via centrifugation. Here are solids in fluids, liquids in fluids, and gases in solids and liquids. Thick and heavy components are moved from the inside of the tube to the outside by centrifugal force. It makes it simpler for the substance to sink completely.
Figure 8. Centrifuge Machine.
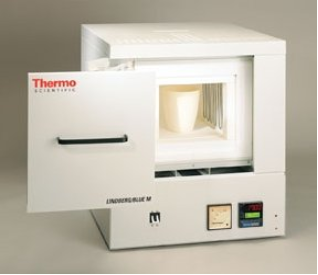
2.2.5. Furnace
An appliance that generates and transmits warmth to substances to bring about physical and chemical change is called a furnace. Typically, heat is produced by using liquid or vapor fuel, applying electric power via resistive heating or induction warming, or both. The four fundamental kinds of heaters are powered by electric, oil, gas, and propane. While electric burners may heat the atmosphere by exposing hot portions, other kinds of furnaces frequently need a converter or cylinder to heat the lower atmosphere. The furnace converts heat into the air, which is subsequently circulated through the ductwork of a home and out vents by blower fans. The purpose of a research lab chamber furnace is to heat substances that are enclosed within the chamber.
The samples are placed into the processing chamber. The user enters a temperature set point into the burner controller, and the temperature rises in response. Heat is distributed evenly across the chamber, gradually heating the samples inside. A laboratory chamber furnace is heating equipment that complies with the temperature control and uniformity criteria of laboratory operations. It's a common piece of equipment in many labs, and it's used for a variety of tasks, such as ashing and thermal treatment of materials. It's a common piece of machinery in many labs, and it's used for a variety of tasks, like ashing and heat treatment of substances. Ashing, thermal treatment of nanomaterials, carbon nanotube manufacturing, calcination, quenching, crystal growth, annealing, curing, loss on ignition analysis, Thermogravimetric analysis, and sintering are just a few of the applications for laboratory chamber furnaces. Metallic wire heating components with a maximum temperature of 1000°C-1200°C are the most popular. With a silicon carbide heat source, lab furnaces can reach 1600°C and 1800°C with a molybdenum disilicide heat source.
2.3. Synthesis of Ag Nanoparticles
Beakers, burettes, flasks, and the crucible sintering rod were all rinsed in distilled water before starting the sample preparation. The Silver/Ag nanomaterial will be prepared through a sol-gel technique. This was done to make sure the samples were clean. As with silver precursors, AgNO3 (silver nitrate) will be employed. 0.01 M solution of silver prepared, and make a solution (A) in a beaker 0. 016987g of silver nitrate (AgNO3) was dissolved in 10ml distilled water and agitated for 1 hour on a magnetic stirrer. Then, solution (B) was made in a beaker with 0.2g NaOH (Sodium hydroxide), 1 ml Acetic Acid, and 10 mL distilled and stirred for 1 hour on a magnetic stirrer. Then both solutions A and B mix again for one hour of stirring. After that, the product was dried for two hours (2 h) inside an electric oven set at 80°C. 0.01 solutions were prepared, and a similar process was repeated for 0.02 M and 0.03M. The combined solution was then heated for half an hour at 450°C in a muffle furnace.
2.4. Synthesis of Cerium Dioxide
Beakers, burettes, flasks, and the crucible sintering rod were all rinsed in distilled water before starting the sample preparation. This was done to make sure the samples were clean. NaOH (0.40g) was used in a typical method for producing CeO2 nanoparticles; it was diluted in 10mL of distilled water and agitated on a magnetic stirrer for half an hour. For one hour, 0.4043g of Cerium Sulfate tetrahydrate (Ce (SO4)2 · 4H2O) was added to this agitated solution. Both solutions were mixed and stirred at room temperature until the solution became homogeneous. We used a hydrothermal approach in our lab to make ceria nanoparticles with various morphologies. We made ceria nanorods in an autoclave with 50 mL of Teflon liner at 120°C for 15 hours using (Ce(SO4) 2 · 4H2O) and NaOH as reactants. This solution was centrifuged after 15 hours of autoclaving, and the result was dried for two hours (2 h) inside an electrical oven set at 80°C. The combined solution was then heated for half an hour at 450°C in a muffle furnace.
2.5. Crystal Structure of Cerium Oxide (CeO2)
The fluorite form of Cerium dioxide contains the space group Fm3m and is composed of a straightforward cubic oxygen sub-lattice with alternate cube centers occupied by cerium ions. This diagram of the stoichiometric CeO2 displays the eight correlated cerium and the four coordinated oxygen (represented by solid red big balls). Ceria is at the center of a tetrahedron with oxygen atoms at its corners.
The crystalline oxygen atoms in CeO2 are eliminated when oxygen molecules are produced to keep the electrical conductivity constant while cerium cations are exchanged with lower valence elements (M² M3) to form solid solutions. Due to the coexistence of Ce1 and Ce3 ions, the nanoceria crystal typically has a few flaws.
Cerium dioxide, which usually has a cubic nanofiber, has been thought to be a good high-refractive index compound film in particular and multilayered photosensitive coatings. As a result, innovative bi-layer photoanodes are made of nano-cubic. Ceria elements with huge mirror-like facets are likely to be a promising option for achieving more suitable light-harvesting and refining the performance of DS solar cells. Though. Since they tend to form huge aggregates and the packing density in the films is frequently relatively low, 45-cubic cerium oxide NPs haven't found widespread use as light-scattering materials. For DSSCS applications, we use a screen-printing approach to introduce a submicrometer-sized ceria (CeO2) thin coating (1.5 m) on the upper surface of a thick Titanium O2 50 layer. When using a back-illumination method, superior cubic nanomaterials with visible mirror-like façades are expected to scatter and reflect light similarly to mirrors, resulting in high light harvesting efficiency. Schematic model for the mirror-like dispersion phenomenon in a bilayered photocatalyst.
CeO2 photocatalytic and photoelectrocatalytic capabilities suggest that it could be used as a photocatalyst in sewage exposure. Ceria can be used as a/an corrosion-resistant coating for metals and alloys; solid oxide fuel cells have an oxygen ion conductor; a polishing agent for glass; a sunscreen in cosmetic products; a sensing element additive in ceramic materials In fluid catalytic splitting Three-way catalysis anode substance for lithium-ion batteries.
3. Results and Discussion
3.1. Sol-gel Technique
In materials, the method used in larger particle converted into smaller particles is called the sol-gel technique. In this process, we get two types of materials: sol and other one is gel. In this process, the monomers are altered into a sol, and other one was changed into gel. At the start declared that the sol-gel process synthesizes the eternity of ceramics and constituents. In this path, various types of sol gel materials are present, such as inorganic pigments, catalysis, drugs, and metallic and magnetic nanoparticles. The watery chemical process was sol-gel, and many different processes for the preparation of the materials like hydrolysis, gelation, polycondensation, drying, and crystallization.
The sol-gel method is a highly efficient chemical process for producing high- purity nanostructures or nanocomposites. This method involves the preparation of a solution that contains the precursors and the subsequent breakdown of those precursors into the appropriate nanostructure at a suitable temperature. Ag nanostructure was successfully created using the sol-gel technique. Hydrothermal synthesis refers to the various processes and a method for creating a single crystal that depends on the dissolution of minerals in heated, high-pressure water and is used to crystallize compounds from increased aqueous solutions at high vapor pressures. High vapor pressure CeO2 materials are produced via the hydrothermal method at melting temperatures.
3.2. X-ray Powder Diffraction (XRD)
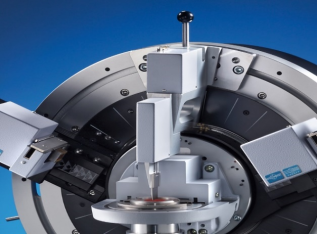
The dual wave/particle character of X-rays is used in X-ray diffraction (XRD) to gather info on the construction of crystal structures. The approach is primarily used to identify and characterize chemicals based on their diffraction patterns . Once an X-ray is directed at a mineral, it disperses in a shape that is exclusive to the assembly. In particle X-ray diffraction, the object's powder is used to create the diffraction grating instead of a single crystal. To ascertain a molecule's structure or form, X-ray diffractometer (XRD) is used. Long-order can be seen in the way that material atoms deflect light via X-rays . A material is exposed to X-rays using the XRD methodology, which then measures the intensity and dispersion orientations of the X-rays that leave the substance . The following are the key advantages of X-ray diffraction: It's a rapid as well as an active way to identify unfamiliar raw materials. Simply preparing a few samples for testing is performed. The findings are rather easy to understand. Photon energy in X-rays ranges. to 100eV-100k eV .
An X-ray tube, an X-ray sensor, and a taster holder are the three fundamental apparatuses of an X-ray diffractometer. By heating a filament in an X-ray tube to create electrons, which are then accelerated more towards a target by the addition of power and bombarded with much more electron density, X-rays are created . When ions get enough energy to push out the target substance's outermost electron, a unique X-ray spectrum is produced . The substance is shielded from such X-rays before they can be sent there . The specimen or detector is turned while the energy of the X-ray is measured . When the Bragg Equation is satisfied by the geometry of the incoming X-rays infringing on the sample, an interference pattern takes place, producing an intensity peak .
3.3. XRD Pattern of CeO2
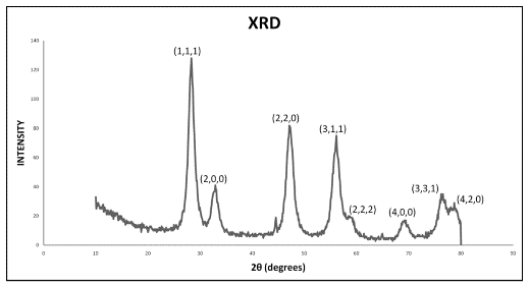
The powder XRD pattern of CeO2 nanoparticles (NPs) as they were manufactured is shown in Figure 11. The distinct peaks in this picture are 2-28.5, 33.9, 47.8, 56.2, 58.5, and 69.10, which correspond to the lattice planes (111), (200), (311), (222), (400), and (420) respectively. All of the powder XRD pattern reflections in this activity instance were listed in the indicator utilizing the software application. No other phase peak was found, suggesting the product's excellent purity.
Figure 11. XRD Cerium nanoparticles.
The XRD results from the powder's crystallite size were calculated with the UNIT CELL technology coder, as the results were a = b = c 5.416, 90. According to a detailed report published in the literature (JPDS43-1002), the lattice parameters discovered in ceria nanoparticles are thought to provide a good understanding. The large peaks in the powder XRD pattern of CeO2 nanoparticles confirm the creation of tiny nanoparticles .
Planes (111), (200), and (220) Peaks of an XRD analysis can be indexed since the pattern contains peaks that were observed corresponding to the (311), (200), & (220) Bat surface. The XRD pattern showed the existence of diffraction peaks correlating to the planes (111), (200), or (220). The mean particle size calculated using the Scherrer technique on the major (111) diffraction pattern of the X-ray diffraction peaks is 202 am, which matches the size of solitary NPs detected in TEM.
3.4. Scanning Electron Microscopy (SEM)
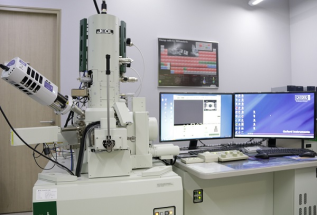
By analyzing an object's surface, scanning electron microscopy (SEM) can take high-resolution images of it. An absorbed beam of electrons is utilized in SEM to achieve this . The images that result reveal information about the object's composition and physical characteristics. A scanning electron microscope is used to gather this information regarding composition or topography . A beam of electrons is used in transmission electron microscopy to examine material. Throughout this procedure, the photon energy passes through several lenses and slits that concentrate it. Since the process is taking place in an atmosphere, no atoms or molecules in the microscope column can interact with the electron beam . By doing this, high-quality imaging is guaranteed. The suction also shields the electron gun from vibration and noise .
In a dense grid, the beam of light sweeps the pattern's surface in segments from side to side and from top to bottom. Atoms on the sample's contact with the beam engage in interaction . This contact results in the formation of secondary electrons, particles, rays, and backscattered light that are unique to the sample. The microscope's sensors take up the stimuli, creating high-resolution pictures that are displayed on a computer monitor . The electronic source is already situated at the top of the microscope's column and produces electrons. The anode structure's positive charge pulls the electrons in, creating a stream . The condensing lens, which further controls the number of electrons in the beam, determines the laser's size. The width of the laser affects the picture quality. The laser's size can be changed by using a wide range of sorts. The beam is bent by the scanner coil along the x- and y-axis such that it sweeps throughout the sample's area in a dense grid . The imaging viewfinder is the final lens in a chain that generates a beam of electrons. Additionally, the beam is concentrated in a small area by the lens that is nearest to the specimen.
Figure 12. SEM Characterization Setup.
3.4.1. SEM Analysis of Cerium Oxide Nanoparticles
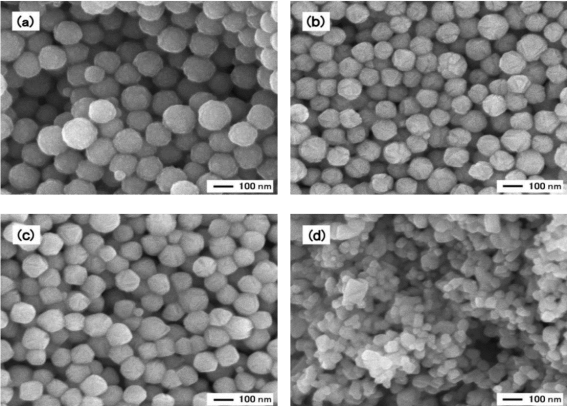
An electron microscope scanner was used to examine the cerium NPs and dense film used in this study. (a) This image depicts pure CeO2 nanoparticles and a nanostructure of small size. (b) The image shows a silver and cerium heavy film composite made up of spongy nanostructures photographed at 100 nm; (c) this image shows nanoparticles photographed at 100 nm with a flat surface nanostructure, and (d) the thick film is made up of a flat sheet of nanomaterials photographed at 100 nm. The thick film obtained after firing the substrate at 100-1000 exhibited a hopeless construction of nanoparticles. The medium-sized nanomaterials were 70nm and were distinguished on the substrate by being warmed 100-500. This is because the route of the spherical shell after thermal treatment at temperatures of 100 or higher suggests that the NPs are vital for the core at the end of hard movies.
Figure 13. SEM Analysis of cerium oxide nanoparticles.
3.4.2. SEM Analysis of Ag Nanoparticles
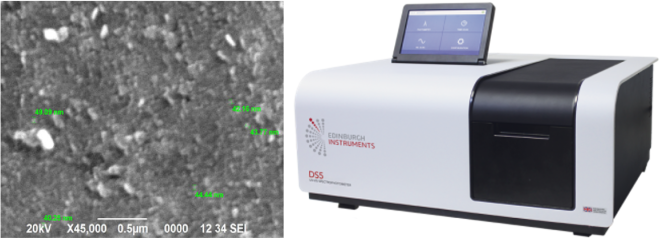
Furthermore, SEM studies of the produced Ag (silver) nanoparticles revealed that they ranged in size from 35 to 60 nm. This picture shows that nanoparticles photographed at 400 nm have a rough surface, and the boundaries of the nanostructure are not clear.
Figure 14. SEM Analysis of Ag Nanoparticles.
3.5. UV-Vis Spectroscopy
A method for determining the purity of compounds is UV-Vis spectroscopy . Many substances have fluorescent dyes, which absorb specific frequencies of ultraviolet visible sunlight. The light source, sample holder, monochromator, detector, and interpreter are the five major components of UV-visible spectroscopy . UV-Vis Spectroscopy in Practice Technique Analyses of DNA and RNA for pharmaceuticals. Bacterial culture is a term that refers to the cultivation of bacteria. Analyze the beverage the visible light spectrum includes 400-700 nm, while the UV range includes 100-400 nm .
However, because light sources in this range are expensive, the majority of spectrophotometers work in the profound ultraviolet region of 100-200 nm major drawback is the amount of time needed to set up a UV-VIS spectrometer. For utilizing a UV-VIS spectrum analyzer, setup is essential. UV or UV-VIS spectra are often measured at elevated/low pH, and the outcomes of both are contrasted to a standard solution for the material in question . Since the Spectrometer only absorbs a small quantity of light over a short path length, it is frequently not the most sensitive method fluorescence is one of the more precise spectroscopic methods, because though most compounds don't fluoresce, it isn't as extensively used . Observational methods for making other conclusions, like infrared spectra, are also sensitive to UV-Vis .
3.5.1. UV-Vis Optical Spectrum of Silver
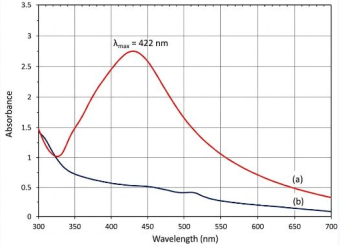
The absorption maxima were noted by UV-Vis spectrophotometric light spectrum 400 nm-wavelength at 420 nm, which is excellent and consistent with the theoretical result. The valence bands are relatively close to one another, and electrons can freely flow between them. A Surface Plasmon Resonance (SPR) absorption band is formed by these free electrons. The size of the particles, chemical dielectric medium, and environment all play a role in absorption. The absorption spectra for small metallic particles (diameter 20 nm) are mostly determined by the dipole oscillation. The SPR peak changes to the lower wavelength side as size is reduced, both theoretically and empirically. Figure 15 displays the UV-Vis immersion spectra of Ag NPs distributed in chloroform. The absorption SPR (Surface Plasmon resonance) peak is measured at 422 nm in the visible region, which agrees well with the predicted wavelength (nm).
Figure 15. The UV-Visible absorption spectra of Ag nanoparticles.
UV-Vis optical spectrum of CeO2 shows an energy gap of 3.2 eV, which is not as great as the valence band of commercial CeO2. The spectra of CeO2, a type of semiconductor, fluctuate between 2.7eV and 3.4 eV depending on the manufacturing procedure. The redshift in the CeO2 sample could be attributed to the trivalent ionic cerium component.
3.5.2. UV-Vis of Ag/CeO2 Nanocomposites
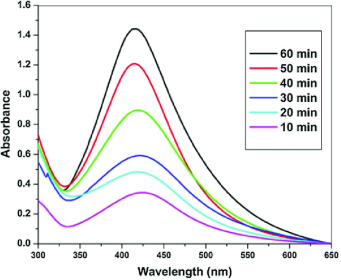
The absorption maxima were noted by UV-Vis spectrophotometric light spectra at 420 nm, which is exceptional and consistent with the theoretical result. Sample 1 depicts the maximum absorbance of light and the wavelength that corresponds to this particular maximum. It is also absorbing some amount of light and other wavelengths from this particular point. We see different concentrations if we record the spectra under identical conditions.
Figure 16. UV- Visible spectra.
3.6. FTIR (Fourier Transform Infrared Radiation Spectroscopy)
FTIR Spectroscopy is a basic technique that is used to determine the interaction between the infrared radiation (IR) and a specimen that can be liquid or that can be solid . It determines the various frequencies and the intensity of these absorptions that the sample absorbs. The measurements of the frequencies that the sample absorbs are very useful for describing the specimen's chemical makeup because the functional chemical groups are important for the absorption at various frequencies. Now, the latest FTIR instruments are more sensitive, faster, and digitalized than older ones. A Fourier-transform infrared spectrometer can identify hundreds of VOCs (Volatile organic compounds) emitted from industrial sources . FTIR spectroscopy is used to analyze the compositional and structural components related to environmental samples . FTIR spectroscopy gives non-destructive, real-time, and simultaneous analysis of complex samples, for example, the smoke of a cigarette. Any structural changes that can be produced in samples due to the biodegradation process can be determined by FTIR .
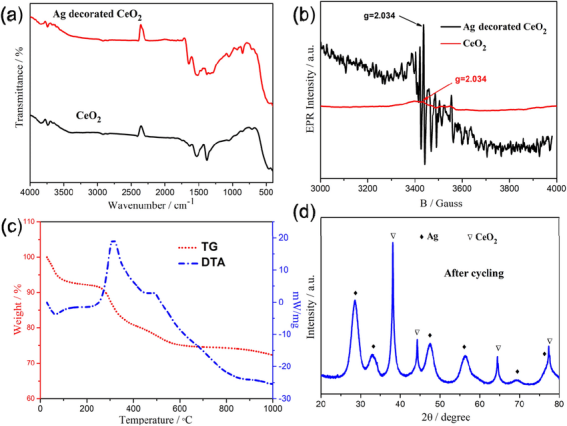
The FTIR scales used to analyze the adsorption classes on the surfaces of produced CeO2 and silver-coated CeO2 NPs are shown in the figures. The range of the FT-IR spectrum of pure CeO2 was 600 to 1600 cm-1. This spectrum showed five absorbance peaks at 667, 725, 833, 1339, 1507, and 15cm-1. The deformation mode of the Ce-O bond is responsible for the main absorption group detected at 667 cm-1. Additional peaks observed at 1595 cm-1 relate to O-H twisting atmospheres and the two Ce-O stretching vibrations. The Ag-decorated CeO2 samples clearly exhibit an extra peak at 833 cm-1 which might be attributable to the creation of an Ag-O peak at 2109 cm-1 corresponding to extending vibrations. The peak at 1558 cm-1 is due to symmetric bending of H2O, whereas the peak around 1507 cm-1 reveals the stretching vibrations of CH2 bonding adsorbed from the ambient.
Figure 17. FTIR Ag-doped CeO2 infrared radiation.

4. Conclusion
Ag-doped CeO2 (Ag@CeO2) nanoparticles were synthesized via the sol-gel method. The structural properties were investigated using X-ray diffraction (XRD), which confirmed the formation of a face-centered cubic (FCC) fluorite crystal structure. Ag-doping resulted in a slight reduction in the average crystallite size from 19.29 nm for pure CeO2 to 18.70 nm for Ag-doped CeO2, as calculated using the Scherrer equation. Scanning electron microscopy (SEM) analysis observed the irregularly distributed, nearly spherical nanoparticles with a non-uniform surface morphology, while energy-dispersive X-ray (EDX) analysis confirmed the presence of cerium (Ce), silver (Ag), and oxygen (O) in the synthesized nanocomposites. Fourier transform infrared (FTIR) spectroscopy identified the characteristic vibrational bands corresponding to O-Ce-O, Ce-Ag, and O-Ag bonds, confirming the successful formation of Ag-doped CeO2 nanoparticles. UV–Visible spectroscopy analysis observed strong absorption in the ultraviolet region and revealed improved optical characteristics of Ag-doped CeO2 NPs. The thermal analysis conditions (drying at 80°C and calcination at 500°C) played a significant role in improving the crystallinity, phase purity, and optical properties of the nanoparticles. The synthesized Ag@CeO2 nanocomposites show excellent photocatalytic activity under sunlight for the degradation of organic dyes, including methyl red, methylene blue, methyl orange, and malachite green. Photocatalytic experiments performed over a pH range of 3–11 showed that the highest degradation efficiency was achieved under alkaline conditions (pH 11). Compared with the other dyes, malachite green exhibited the fastest degradation rate, which can be attributed to enhanced charge separation, increased active surface area, and favorable electrostatic interactions under basic conditions. Altogether, these results showed that Ag-doped CeO2 NPs are efficient photocatalysts with considerable potential for wastewater treatment and pollutant removal.
Abbreviations

FCC

Face Centered Cube

TEM

Transmission Electron Microscopy

SEM

Scanning Electron Microscopy

FTIR

Fourier Transform Infrared

XRD

X-Ray Power Diffraction

NPs

Nanoparticles

Acknowledgments
The authors declare that this research was conducted and the manuscript was prepared without any external financial support. All writing, figure preparation, and manuscript design were carried out by the authors at the Department of Chemistry, University of Agriculture, Faisalabad (38000), Punjab, Pakistan.
Author Contributions
Tasmea Noureen Kosir: Conceptualization, Formal Analysis, Investigation
Arooj Sajjad: Supervision, Writing – review & editing
Iqra Arshad: Data curation, Formal Analysis, Investigation, Validation
Sajjad Hussain: Funding acquisition, Validation, Formal Analysis
Muhammad Javid: Supervision, Writing – original draft, Writing – review & editing
Muhammad Sajid Abass: Conceptualization, Investigation, Writing – review & editing
Muhammad Hasnain: Conceptualization, Funding acquisition, Investigation, Project administration
Abuzar Hasnain Raza: Formal Analysis, Investigation, Validation
Iqra Khaliq: Investigation, Writing – review & editing
Ateeq Ur Rehman: Formal Analysis, Writing – review & editing
Data Availability Statement
Data will be made available on request.
Conflicts of Interest
The authors declare no conflicts of interest.
References
[1] Sun, H., Sohail, A., Shah, A., Liaqat, Z., & Gul, M. (2025). From precursors to performance: Diverse synthesis strategies for cerium oxide nanoparticles. Phytopharmacology Research Journal, 4(2), 28-42.
[2] Selvaraj, S., Chauhan, A., Radhakrishnan, A., Rana, G., Dutta, V., Batoo, K. M., & Ghotakar, S. (2024). Cerium oxide nanoparticles and their polymeric composites: advancements in biomedical applications. Journal of Inorganic and Organometallic Polymers and Materials, 34(12), 5691-5717.
[3] Peera, S. G., & Kim, S. W. (2025). Rare earth Ce/CeO2 electrocatalysts: role of high electronic spin state of Ce and Ce3+/Ce4+ redox couple on oxygen reduction reaction. Nanomaterials, 15(8), 600.
[4] Zhu, C., Tian, Q., Wang, B., Liu, J., Han, J., Le, S.,... & Xu, H. (2025). Applications of CeO2-based heterojunctions in photocatalytic bactericidal and antitumor therapy. Journal of Rare Earths, 43(3), 441-452.
[5] Zhuang, X., Magnone, E., Han, S. W., & Park, J. H. (2024). Novel surface modification strategies for enhanced CeO2 nanoparticle dispersion and suspension stability. Ceramics International, 50(13), 24801-24814.
[6] Alaguvel, K., Arun, V., Rahmayanti, Y. D., Handayani, M., Parvathy, S., Vijayakumar, P.,... & Sivakumar, S. (2025). Inorganic-carbon nanohybrid rGO/Ag-CeO2 nanocomposites with structural insights and dual photocatalytic-antibacterial properties. Journal of Inorganic and Organometallic Polymers and Materials, 1-17.
[7] Negi, K., Umar, A., Chauhan, M. S., & Akhtar, M. S. (2019). Ag/CeO2 nanostructured materials for enhanced photocatalytic and antibacterial applications. Ceramics International, 45(16), 20509-20517.
[8] Yaqoob, A. A., Umar, K., & Ibrahim, M. N. M. (2020). Silver nanoparticles: various methods of synthesis, size affecting factors and their potential applications–a review. Applied Nanoscience, 10(5), 1369-1378.
[9] Mustapha, N., & Hjiri, M. (2026). Advances in eco-efficient and accelerated sol–gel routes for hybrid nanostructures. Journal of Sol-Gel Science and Technology, 117(2), 59.
[10] Engineering, A. I. M. S. A. (2025). RETRACTION: Nanomaterial by Sol‐Gel Method: Synthesis and Application.
[11] Vedhantham, K., Karthik, K., Keerthi, P., & Ramalingam, K. (2025). Biogenic novel Z-scheme Ag–CeO2/MgAl-LDH composite for enhanced photocatalytic dye degradation. Materials Chemistry and Physics, 337, 130539.
[12] Hussain, M., Ali, G., Hussain, F., Hussain, M., & Arif, M. M. (2024). Silver doped CO2 nanocomposites for photo degradation of selected azo dyes. Journal of the Pakistan Institute of Chemical Engineers, 52(2).
[13] Katta, V. K. M., & Dubey, R. S. (2021). Green synthesis of silver nanoparticles using Tagetes erecta plant and investigation of their structural, optical, chemical and morphological properties. Materials Today: Proceedings, 45, 794-798.
[14] Pachaiappan, R., Nagesh, S. D., Nayak, A. K., Arenas-Herrera, M. J., Vinayagamurthi, B., & Cornejo-Ponce, L. (2025). An enhanced solar driven photodegradation of methylene blue and antibacterial activity by Ag doped CeO2 nanocatalyst. Chemical Papers, 1-20.
[15] Arun Kumar, T., Mahimairaj, P., Venkatesh, R., Kistan, A., & Rajeswaran, P. (2026). Investigation of antibacterial and organic pollutants degradation using UV-light hypersensitive chitosan-doped CeO2-Ga2O3 binary nanocomposites. Journal of Sol-Gel Science and Technology, 118(1), 12.
[16] Ortiz Ortega, E., Hosseinian, H., Rosales López, M. J., Rodríguez Vera, A., & Hosseini, S. (2022). Characterization techniques for chemical and structural analyses. In Material Characterization Techniques and Applications (pp. 93-152). Singapore: Springer Singapore.
[17] Gruene, T., & Mugnaioli, E. (2021). 3D electron diffraction for chemical analysis: instrumentation developments and innovative applications. Chemical reviews, 121(19), 11823.
[18] Khan, M. M. (2025). X-ray diffraction. Photocatalysts: Synthesis and Characterization Methods, 213-223.
[19] Khan, H., Yerramilli, A. S., D'Oliveira, A., Alford, T. L., Boffito, D. C., & Patience, G. S. (2020). Experimental methods in chemical engineering: X‐ray diffraction spectroscopy—XRD. The Canadian journal of chemical engineering, 98(6), 1255-1266.
[20] Kiani, D. (2023). X-ray diffraction (XRD). In Springer Handbook of Advanced Catalyst Characterization (pp. 519-539). Cham: Springer International Publishing.
[21] Goldstein, J. I., Newbury, D. E., Michael, J. R., Ritchie, N. W., Scott, J. H. J., & Joy, D. C. (2017). X-rays. In Scanning Electron Microscopy and X-Ray Microanalysis (pp. 39-63). New York, NY: Springer New York.
[22] Egdell, R. G., & Bruton, E. (2020). Henry Moseley, X-ray spectroscopy and the periodic table. Philosophical Transactions of the Royal Society A, 378(2180), 20190302.
[23] Widmer, W. R., & Thrall, D. E. (2024). Radiation protection and physics of diagnostic radiology. Thrall's Textbook of Veterinary Diagnostic Radiology-E-Book, 1.
[24] Newbury*, D. E., & Ritchie, N. W. (2013). Is scanning electron microscopy/energy dispersive X‐ray spectrometry (SEM/EDS) quantitative?. Scanning, 35(3), 141-168.
[25] Ukkunda, N. S., Santhoshkumar, P., Paranthaman, R., & Moses, J. A. (2025). X-ray diffraction and its emerging applications in the food industry. Critical Reviews in Food Science and Nutrition, 65(24), 4660-4675.
[26] Behling, R. (2021). Modern diagnostic x-ray sources: technology, manufacturing, reliability. CRC Press.
[27] Vettumperumal, R., Dhineshbabu, N. R., PV, E., & Kit, C. C. (2024). XRD peak profile and inverse pole figure analysis of ceria (CeO2) nanoparticles. Iranian Journal of Science, 48(6), 1653-1661.
[28] Wang, G., Mu, Q., Chen, T., & Wang, Y. (2010). Synthesis, characterization and photoluminescence of CeO2 nanoparticles by a facile method at room temperature. Journal of Alloys and Compounds, 493(1-2), 202-207.
[29] Kannan, M. (2018). Scanning electron microscopy: Principle, components and applications. A textbook on fundamentals and applications of nanotechnology, 81-92.
[30] Ali, A., Zhang, N., & Santos, R. M. (2023). Mineral characterization using scanning electron microscopy (SEM): a review of the fundamentals, advancements, and research directions. Applied Sciences, 13(23), 12600.
[31] Prakash, D., & Kotian, R. P. (2025). Computed Tomography: Physics, Principle of Operation, Quality Control, and Safety. In Fundamentals of X-ray Imaging: Basic Principles, Quality Control, Clinical Applications, and Safety (pp. 313-415). Singapore: Springer Nature Singapore.
[32] Podor, R., Bouala, G. N., Ravaux, J., Lautru, J., & Clavier, N. (2019). Working with the ESEM at high temperature. Materials Characterization, 151, 15-26.
[33] Kisielowski, C. (2015). Observing atoms at work by controlling beam–sample interactions. Advanced Materials, 27(38), 5838-5844.
[34] Thomson, E. E., Harfouche, M., Kim, K., Konda, P. C., Seitz, C. W., Cooke, C.,... & Naumann, E. A. (2022). Gigapixel imaging with a novel multi-camera array microscope. Elife, 11, e74988.
[35] Sun, Z., Pan, J., Chen, W., Chen, H., Zhou, S., Wu, X.,... & Zhang, Q. (2024). Electrochemical processes and reactions in rechargeable battery materials revealed via in situ transmission electron microscopy. Advanced Energy Materials, 14(2), 2303165.
[36] Wischnitzer, S. (2013). Introduction to electron microscopy. Elsevier.
[37] Khalid, K., Ishak, R., & Chowdhury, Z. Z. (2024). UV–Vis spectroscopy in non-destructive testing. In Non-destructive material characterization methods (pp. 391-416). Elsevier.
[38] Mandru, A., Mane, J., & Mandapati, R. (2023). A review on UV-visible spectroscopy. Journal of Pharma Insights and Research, 1(2), 091-096.
[39] Bunzel, M., & Penner, M. H. (2024). Ultraviolet, Visible, and Fluorescence Spectroscopy. In Nielsen's Food Analysis (pp. 77-94). Cham: Springer International Publishing.
[40] Haque, F., Bubli, S. Y., & Khan, M. S. (2021). UV–Vis spectroscopy for food analysis. In Techniques to measure food safety and quality: Microbial, chemical, and sensory (pp. 169-193). Cham: Springer International Publishing.
[41] Gebishu, M., Fikadu, B., Bekele, B., Tesfaye Jule, L., N, N., & Ramaswamy, K. (2022). Fluorescence and UV/visible spectroscopic investigation of orange and mango fruit juice quality in case of Adama Town. Scientific Reports, 12(1), 7345.
[42] Sitorus, R., Herman, and Hendro. Optical Characteristic Properties of Probiotic Drink Using Spectrophotometer UV/Vis and FTIR. in Journal of Physics: Conference Series. 2019. IOP Publishing.
[43] Power, A. C., Chapman, J., Chandra, S., & Cozzolino, D. (2019). Ultraviolet-visible spectroscopy for food quality analysis. Evaluation technologies for food quality, 91-104.
[44] Siddique, I. (2024). Exploring functional groups and molecular structures: a comprehensive analysis using FTIR spectroscopy. Chemistry Research Journal, 9(2), 70-76.
[45] Xia, L., Liu, Y., Chen, R. T., Weng, B., & Zou, Y. (2024). Advancements in miniaturized infrared spectroscopic-based volatile organic compound sensors: A systematic review. Applied Physics Reviews, 11(3).
[46] Moura, P. C., Vassilenko, V., & Ribeiro, P. A. (2023). Ion mobility spectrometry towards environmental volatile organic compounds identification and quantification: a comparative overview over infrared spectroscopy. Emission Control Science and Technology, 9(1), 25-46.
[47] Xing, Y., Wang, G., Zhang, T., Shen, F., Meng, L., Wang, L.,... & He, S. (2022). VOC detections with optical spectroscopy. Progress In Electromagnetics Research, 173, 71.
[48] T Tkachenko, Y., & Niedzielski, P. (2022). FTIR as a method for qualitative assessment of solid samples in geochemical research: a review. Molecules, 27(24), 8846.
[49] Al-Amin, K., Kawsar, M., Mamun, M. T. R. B., & Sahadat Hossain, M. (2025). Fourier transform infrared spectroscopic technique for analysis of inorganic materials: a review. Nanoscale Advances, 7(21), 6677-6702.
[50] Kassem, A., Abbas, L., Coutinho, O., Opara, S., Najaf, H., Kasperek, D.,... & Tiquia-Arashiro, S. (2023). Applications of Fourier Transform-Infrared spectroscopy in microbial cell biology and environmental microbiology: advances, challenges, and future perspectives. Frontiers in microbiology, 14, 1304081.
[51] Francis, G. A., Jeyakumar, S. S., Ray, S., Supreethee, S., & Vashishth, R. (2025). Emerging roles of FTIR spectroscopy in toxic metal profiling: innovations for food safety monitoring. Food Safety and Risk, 12(1), 9.
Cite This Article
  • APA Style

    Kosir, T. N., Sajjad, A., Arshad, I., Hussain, S., Javid, M., et al. (2026). Design, Synthesis, and Characterization of Ag@CeO2 Nanoparticles: Tuning Their Structural, Optical, and Morphological Properties via Sol–Gel Method. American Journal of Materials Synthesis and Processing, 11(2), 38-51. https://doi.org/10.11648/j.ajmsp.20261102.11

    Copy | Download

    ACS Style

    Kosir, T. N.; Sajjad, A.; Arshad, I.; Hussain, S.; Javid, M., et al. Design, Synthesis, and Characterization of Ag@CeO2 Nanoparticles: Tuning Their Structural, Optical, and Morphological Properties via Sol–Gel Method. Am. J. Mater. Synth. Process. 2026, 11(2), 38-51. doi: 10.11648/j.ajmsp.20261102.11

    Copy | Download

    AMA Style

    Kosir TN, Sajjad A, Arshad I, Hussain S, Javid M, et al. Design, Synthesis, and Characterization of Ag@CeO2 Nanoparticles: Tuning Their Structural, Optical, and Morphological Properties via Sol–Gel Method. Am J Mater Synth Process. 2026;11(2):38-51. doi: 10.11648/j.ajmsp.20261102.11

    Copy | Download

  • @article{10.11648/j.ajmsp.20261102.11,
      author = {Tasmea Noureen Kosir and Arooj Sajjad and Iqra Arshad and Sajid Hussain and Muhammad Javid and Muhammad Sajid Abbas and Muhammad Hasnain and Abuzar Hasnain Raza and Samina Liaqat and Iqra Khaliq and Ateeq Ur Rehman},
      title = {Design, Synthesis, and Characterization of Ag@CeO2 Nanoparticles: Tuning Their Structural, Optical, and Morphological Properties via Sol–Gel Method},
      journal = {American Journal of Materials Synthesis and Processing},
      volume = {11},
      number = {2},
      pages = {38-51},
      doi = {10.11648/j.ajmsp.20261102.11},
      url = {https://doi.org/10.11648/j.ajmsp.20261102.11},
      eprint = {https://article.sciencepublishinggroup.com/pdf/10.11648.j.ajmsp.20261102.11},
      abstract = {The present study give information about Ag-doped cerium dioxide (Ag@CeO2) nanoparticles (Agx Ce1-x O2, where x = 0, 0.02, 0.04, and 0.06 molar ratios, corresponding to 0, 2, 4, and 6 mol% Ag) that were synthesized via a cost-effective and novel sol-gel method. Pure and Ag-doped CeO2 samples with varying dopant concentrations were prepared to evaluate the influence of Ag-doping on the fluorite cubic structure of ceria. Characterization Techniques like X-ray diffraction analysis confirmed the phase change from amorphous to face centered cube (FCC) in Ag@CeO2 and crystallite size from 19.29 nm for pure CeO2 to 18.70 nm for Ag-doped CeO2, as calculated using the Scherrer equation. Scanning Electron Microscopy analysis revealed the non-uniform and irregular surface morphology of Ag@CeO2 NPs using SEM micrograph. notable red shift in the absorption edge, corresponding to a bandgap (Eg) narrowing from ~ 3.2 eV down to ~ 2.7 eV with increasing silver concentration. Scanning electron microscopy (SEM) and transmission electron microscopy (TEM) analysis’s showed significant morphological changes, transitioning from uniform spherical grains to agglomerated nanostructures with enhanced surface-to-volume ratios. UV-Visible analysis conformed Fourier-transform infrared (FTIR) spectroscopy, which further validated the formation of Ce-O and Ag-O vibrational modes. Energy-dispersive X-ray spectroscopy (EDX) verified elemental composition and weight percentage distributions. The enhanced optical response and tailored nanostructure make these Ag-CeO2 nanoparticles highly promising candidates for optoelectronic devices, photocatalytic degradation, and biomedical applications.},
     year = {2026}
    }
    

    Copy | Download

  • TY  - JOUR
    T1  - Design, Synthesis, and Characterization of Ag@CeO2 Nanoparticles: Tuning Their Structural, Optical, and Morphological Properties via Sol–Gel Method
    AU  - Tasmea Noureen Kosir
    AU  - Arooj Sajjad
    AU  - Iqra Arshad
    AU  - Sajid Hussain
    AU  - Muhammad Javid
    AU  - Muhammad Sajid Abbas
    AU  - Muhammad Hasnain
    AU  - Abuzar Hasnain Raza
    AU  - Samina Liaqat
    AU  - Iqra Khaliq
    AU  - Ateeq Ur Rehman
    Y1  - 2026/09/18
    PY  - 2026
    N1  - https://doi.org/10.11648/j.ajmsp.20261102.11
    DO  - 10.11648/j.ajmsp.20261102.11
    T2  - American Journal of Materials Synthesis and Processing
    JF  - American Journal of Materials Synthesis and Processing
    JO  - American Journal of Materials Synthesis and Processing
    SP  - 38
    EP  - 51
    PB  - Science Publishing Group
    SN  - 2575-1530
    UR  - https://doi.org/10.11648/j.ajmsp.20261102.11
    AB  - The present study give information about Ag-doped cerium dioxide (Ag@CeO2) nanoparticles (Agx Ce1-x O2, where x = 0, 0.02, 0.04, and 0.06 molar ratios, corresponding to 0, 2, 4, and 6 mol% Ag) that were synthesized via a cost-effective and novel sol-gel method. Pure and Ag-doped CeO2 samples with varying dopant concentrations were prepared to evaluate the influence of Ag-doping on the fluorite cubic structure of ceria. Characterization Techniques like X-ray diffraction analysis confirmed the phase change from amorphous to face centered cube (FCC) in Ag@CeO2 and crystallite size from 19.29 nm for pure CeO2 to 18.70 nm for Ag-doped CeO2, as calculated using the Scherrer equation. Scanning Electron Microscopy analysis revealed the non-uniform and irregular surface morphology of Ag@CeO2 NPs using SEM micrograph. notable red shift in the absorption edge, corresponding to a bandgap (Eg) narrowing from ~ 3.2 eV down to ~ 2.7 eV with increasing silver concentration. Scanning electron microscopy (SEM) and transmission electron microscopy (TEM) analysis’s showed significant morphological changes, transitioning from uniform spherical grains to agglomerated nanostructures with enhanced surface-to-volume ratios. UV-Visible analysis conformed Fourier-transform infrared (FTIR) spectroscopy, which further validated the formation of Ce-O and Ag-O vibrational modes. Energy-dispersive X-ray spectroscopy (EDX) verified elemental composition and weight percentage distributions. The enhanced optical response and tailored nanostructure make these Ag-CeO2 nanoparticles highly promising candidates for optoelectronic devices, photocatalytic degradation, and biomedical applications.
    VL  - 11
    IS  - 2
    ER  - 

    Copy | Download

Author Information
  • Abstract
  • Keywords
  • Document Sections

    1. 1. Introduction
    2. 2. Experimental Procedure
    3. 3. Results and Discussion
    4. 4. Conclusion
    Show Full Outline
  • Abbreviations
  • Acknowledgments
  • Author Contributions
  • Data Availability Statement
  • Conflicts of Interest
  • References
  • Cite This Article
  • Author Information