Research Article | | Peer-Reviewed

ACT and APTT Variability as Prognostic Markers for 28-Day In-Hospital Mortality in ECMO Patients: Development and External Validation of a Nomogram

Received: 13 August 2026     Accepted: 24 August 2026     Published: 15 September 2026
Views:       Downloads:
Abstract

Venovenous and venoarterial extracorporeal membrane oxygenation (ECMO) provides life support for patients with refractory cardiopulmonary failure, but bleeding and thrombotic complications remain major causes of mortality. Conventional monitoring based on single activated clotting time (ACT) and activated partial thromboplastin time (APTT) measurements may not adequately capture intra-individual coagulation fluctuations. Previous longitudinal work linked APTT variability with bleeding and mortality, but ACT variability has rarely been evaluated concurrently. This dual-cohort retrospective study evaluated the prognostic value of ACT and APTT variability for 28-day in-hospital mortality and developed an externally validated nomogram. The derivation cohort included 300 patients from the MIMIC-IV database, and the external validation cohort included 200 patients from our ICU. Intra-individual coefficients of variation (CVs) of serial ACT and APTT measurements during ECMO support were calculated. Candidate predictors were screened using LASSO Cox regression and evaluated by Cox proportional hazards regression. Kaplan–Meier analysis compared survival across ACT-CV and APTT-CV tertiles, and model performance was assessed by discrimination, calibration, and decision curve analysis. LASSO identified age, ACT-CV, APTT-CV, lactate, and SOFA score as candidate predictors. Multivariate Cox regression showed that elevated ACT-CV (HR=2.875, 95% CI 1.692–4.891, P<0.001) and APTT-CV (HR=2.630, 95% CI 1.547–4.471, P<0.001) were independent predictors of 28-day mortality. Mortality risk increased progressively across higher ACT-CV and APTT-CV tertiles, with significantly poorer survival in patients with greater coagulation variability (all log-rank P<0.001). The five-variable nomogram achieved AUCs of 0.85 and 0.81 in the derivation and validation cohorts, respectively, outperforming SOFA and APACHE II scores, with favorable calibration and greater clinical net benefit. Intra-individual ACT and APTT variability may therefore provide accessible prognostic information for early risk stratification and individualized anticoagulation management in ECMO patients.

Published in Cardiology and Cardiovascular Research (Volume 10, Issue 3)
DOI 10.11648/j.ccr.20261003.16
Page(s) 63-77
Creative Commons

This is an Open Access article, distributed under the terms of the Creative Commons Attribution 4.0 International License (http://creativecommons.org/licenses/by/4.0/), which permits unrestricted use, distribution and reproduction in any medium or format, provided the original work is properly cited.

Copyright

Copyright © The Author(s), 2026. Published by Science Publishing Group

Keywords

Extracorporeal Membrane Oxygenation, ACT-CV, APTT-CV, Coagulation Variability, Nomogram, Prognosis

1. Introduction
Extracorporeal membrane oxygenation (ECMO) is a life-saving support modality for adults with refractory acute respiratory failure or refractory cardiogenic shock, yet coagulation-related complications remain a major barrier to improved survival . A landmark Extracorporeal Life Support Organization (ELSO) registry analysis including 7,579 venovenous ECMO (VV-ECMO) patients reported that 40.2% of individuals experienced bleeding or thrombotic events (BTEs). Although thrombotic complications were numerically more frequent, bleeding events were associated with substantially higher in-hospital mortality risk (adjusted odds ratio (OR)=1.69 versus 1.23 for thrombosis), with intracranial hemorrhage and ischemic stroke conferring the worst prognosis . Systemic heparin anticoagulation is mandatory for most ECMO patients to prevent circuit clotting; however, therapeutic windows are narrow, and inter-individual response varies dramatically .
Current bedside anticoagulation monitoring predominantly relies on discrete, single-timepoint ACT and APTT measurements to adjust heparin dosage . This static assessment strategy has critical limitations: isolated laboratory values are easily confounded by hemodilution, organ dysfunction, transfusion and sampling timing, failing to capture dynamic shifts in coagulation homeostasis throughout ECMO support. A recent joint longitudinal-survival model study challenged single-point coagulation testing by proving cumulative APTT elevation and intra-patient fluctuation independently predicted major bleeding and all-cause death in ECMO patients, with dynamic APTT metrics outperforming static thresholds in predictive power. Nevertheless, this prior research was restricted to APTT only, omitted ACT (the most widely used point-of-care coagulation marker in ECMO wards), and did not develop a simplified visual tool for routine clinical risk evaluation .
Furthermore, existing critical illness scoring systems, including the Sequential Organ Failure Assessment (SOFA) and Acute Physiology and Chronic Health Evaluation II (APACHE II) scores, calculate mortality risk solely based on organ dysfunction and physiological parameters, without incorporating serial coagulation monitoring data . No dual-cohort predictive model combining both ACT and APTT variability has been published to date. In this study, we constructed a two-stage cohort consisting of Medical Information Mart for Intensive Care IV (MIMIC-IV) database-derived ECMO patients for model derivation and single-center real-world cases for external validation . Our primary objectives were: (1) to verify whether intra-individual ACT and APTT variability independently predict 28-day in-hospital mortality; (2) to build an easy-to-use nomogram incorporating coagulation fluctuation markers; (3) to comprehensively compare the predictive performance of our novel nomogram with conventional severity scores across discrimination, calibration and clinical net benefit metrics. We hypothesized that elevated ACT/APTT variability would strongly correlate with higher mortality, and the combined nomogram would achieve superior prognostic performance for ECMO patients .
2. Materials and Methods
2.1. Study Design and Cohort Population
This retrospective dual-cohort observational study followed the Transparent Reporting of a multivariable prediction model for Individual Prognosis Or Diagnosis (TRIPOD) reporting guidelines for prediction model development and external validation, consistent with the cohort design of large ELSO registry analysis and single-center longitudinal ECMO coagulation research1 . Two independent cohorts were established separately for model derivation and external validation:
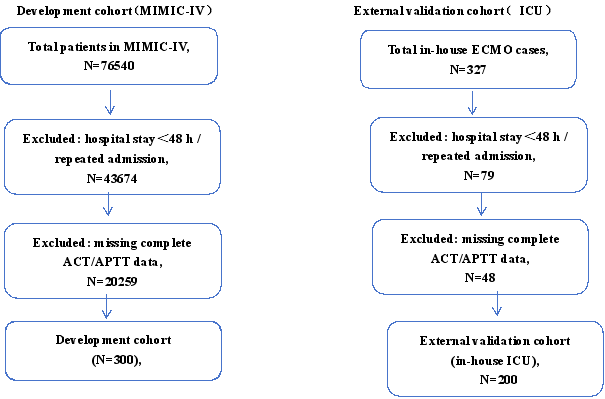
1) Derivation cohort: Adult ECMO recipients screened from the MIMIC-IV v2.0 critical care database. MIMIC-IV contains de-identified electronic health records of ICU patients admitted to Beth Israel Deaconess Medical Center from 2008 to 2019. Ethical approval was exempted for de-identified retrospective database analysis. Total hospitalized patients (n=76540) were sequentially filtered by exclusion criteria: hospital stay <48h, repeated ECMO runs, incomplete serial ACT/APTT laboratory records, missing core clinical covariates. Finally, 300 eligible patients were included for model construction.
2) External validation cohort: Consecutive adult patients receiving VV/VA ECMO support in the intensive care unit (ICU) of our tertiary hospital from January 20XX to December 20XX. Initial total ECMO admissions were 327; exclusion standards matched the derivation cohort (hospital stay <48h, repeated support, insufficient serial ACT/APTT data). A total of 200 patients were retained for independent model testing.
Unified exclusion criteria for both cohorts: age <18 years, pre-ECMO confirmed disseminated intravascular coagulation, baseline severe inherited coagulation disorders, incomplete survival outcome data within 28 days after ECMO initiation.
2.2. Data Collection and Variability Calculation
Standardized data extraction was performed for all participants, covering three categories of variables
1) Baseline demographic and clinical variables: age, sex, ECMO mode (VV/VA), ECMO duration, pre-ECMO organ function markers (serum creatinine, total bilirubin, platelet count, pH, lactate), sequential organ failure assessment (SOFA) score upon ECMO cannulation.
2) Serial coagulation indicators: all ACT and APTT test results obtained during ECMO support. Intra-individual coefficient of variation (CV) was calculated as standard deviation / mean of serial measurements for each patient, defined as ACT-CV and APTT-CV to quantify coagulation fluctuation amplitude, consistent with variability calculation methods described in prior ECMO longitudinal research.
3) Primary endpoint: 28-day all-cause in-hospital mortality after ECMO initiation.
Missing continuous covariate data were handled via multiple imputation, identical to the statistical processing strategy of the ELSO registry cohort analysis.
2.3. Statistical Analysis
All statistical analyses were completed using R software (4.3.1). Two-sided P<0.05 was defined as statistical significance. Continuous variables were expressed as median (interquartile range, IQR), categorical variables as counts (percentages). Baseline characteristics between derivation and validation cohorts were compared using Mann-Whitney U test (continuous variables) and Chi-square test (categorical variables).
2.3.1. Variable Screening
Least Absolute Shrinkage and Selection Operator (LASSO) Cox regression with 10-fold cross-validation was applied to shrink redundant variables and select candidate predictors with non-zero regression coefficients. All clinical variables collected were input into the LASSO model simultaneously. Variables with compressed coefficient equal to 0 were excluded for subsequent regression modeling.
2.3.2 Cox Proportional Hazards Regression
Univariate Cox regression was first performed for all LASSO-screened predictors; variables with P<0.1 entered multivariate Cox regression to identify independent prognostic factors of 28-day mortality. Hazard ratios (HR) and corresponding 95% confidence intervals (CI) were reported. For subgroup stratified analysis, ACT-CV and APTT-CV were divided into three tertiles (low, medium, high fluctuation) to quantify dose-response relationships between coagulation variability and mortality risk. Interaction terms of ACT-CV with age, ECMO mode and lactate were added to multivariate models to test whether the predictive effect of coagulation variability differed across clinical subgroups.
2.3.3. Survival Analysis
Kaplan-Meier survival curves were plotted according to ACT-CV and APTT-CV tertiles, and log-rank test was adopted to compare 28-day survival disparities among three fluctuation groups.
2.3.4. Nomogram Construction and Performance Evaluation
A visual predictive nomogram was built based on all independent predictors identified in multivariate Cox regression. Three standard dimensions of model efficiency were assessed in both derivation and external validation cohorts:
1) Discrimination: Receiver operating characteristic (ROC) curves were drawn at day 28, area under curve (AUC) calculated. SOFA score and APACHE II score were set as control models for head-to-head comparison.
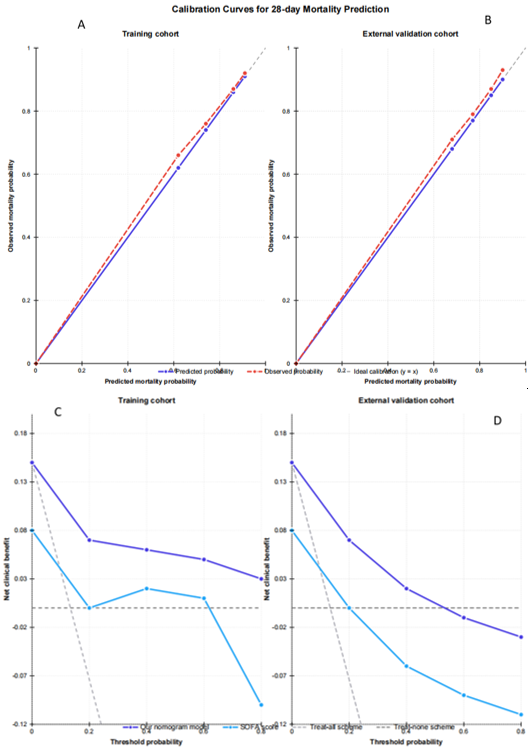
2) Calibration: Calibration curves were generated to visualize the concordance between nomogram-predicted mortality probability and actual observed death proportion; the diagonal line represented perfect predictive calibration.
3) Clinical utility: Decision curve analysis (DCA) was conducted to calculate net clinical benefit across different risk threshold probabilities. The curve representing "no patients receive intervention" was set as the reference baseline. Higher curve position indicated greater clinical intervention value.
3. Results
3.1. Baseline Characteristics of Dual Cohorts
The patient screening flowchart for both cohorts was displayed in Figure 1. After standardized filtering, the derivation cohort contained 300 MIMIC-IV ECMO patients, and the external validation cohort included 20 single-center ECMO patients. Baseline comparisons were summarized in Table 1. No statistically significant inter-cohort differences were observed in age, gender distribution, venovenous (VV) or venoarterial (VA) ECMO proportion, ECMO support duration, ACT-CV, APTT-CV, lactate concentration, baseline SOFA score and 28-day in-hospital mortality rate (all P>0.05). The overall 28-day mortality was 25.7% in the derivation cohort and 26.5% in the validation cohort.
Figure 1. The flow chart of the included population.
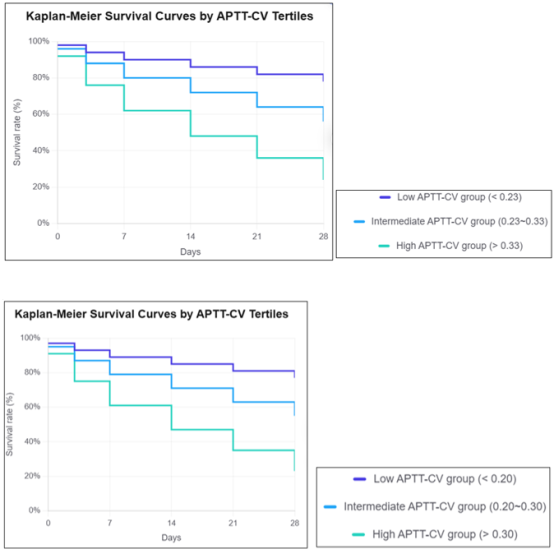
Table 1. Baseline Characteristics.

Derivation cohort(N=300)

External validation cohort(N=200)

P value

Demographic characteristics

Age, median (IQR)

59 (47, 68)

61 (49, 70)

0.612

Male, n (%)

176 (58.7)

113 (56.5)

0.804

Ethnicity, n (%)

0.729

White

212 (70.7)

145 (72.5)

Black

58 (19.3)

36 (18.0)

Other

30 (10.0)

19 (9.5)

Height (cm), median (IQR)

172 (165, 178)

170 (163, 176)

0.587

Hospital LOS (days), median (IQR)

12 (7, 21)

11 (6, 19)

0.426

Comorbidities, n (%)

AIDS

8 (2.7)

5 (2.5)

0.912

Cerebrovascular disease

22 (7.3)

15 (7.5)

0.987

Chronic pulmonary disease

45 (15.0)

32 (16.0)

0.761

Congestive heart failure

38 (12.7)

24 (12.0)

0.823

Diabetes mellitus

52 (17.3)

34 (17.0)

0.925

Mild liver disease

19 (6.3)

13 (6.5)

0.941

Myocardial infarction

26 (8.7)

18 (9.0)

0.908

Peripheral vascular disease

17 (5.7)

11 (5.5)

0.933

Renal disease

31 (10.3)

20 (10.0)

0.915

Rheumatic disease

9 (3.0)

6 (3.0)

1.000

Dementia

12 (4.0)

8 (4.0)

1.000

Paraplegia

7 (2.3)

5 (2.5)

0.894

Peptic ulcer disease

14 (4.7)

9 (4.5)

0.927

Vital signs on admission, median (IQR)

Heart rate (bpm)

102 (88, 116)

105 (90, 118)

0.358

Systolic blood pressure (mmHg)

118 (102, 135)

116 (100, 132)

0.412

Diastolic blood pressure (mmHg)

62 (54, 70)

60 (52, 68)

0.376

Mean blood pressure (mmHg)

78 (68, 88)

76 (66, 86)

0.401

Respiratory rate (bpm)

22 (18, 26)

23 (19, 27)

0.324

SpO2 (%)

94 (90, 97)

93 (89, 96)

0.289

Laboratory parameters, median (IQR)

Lactate (mmol/L)

2.3 (1.5, 3.6)

2.4 (1.6, 3.7)

0.593

Serum albumin (g/L)

28 (22, 34)

27 (21, 33)

0.625

Total bilirubin (μmol/L)

22 (15, 35)

24 (16, 38)

0.517

Blood urea nitrogen (mmol/L)

8.2 (5.1, 12.3)

8.5 (5.3, 12.8)

0.489

Serum creatinine (μmol/L)

76 (45, 112)

78 (47, 115)

0.532

Sodium (mmol/L)

138 (135, 142)

139 (136, 143)

0.316

Potassium (mmol/L)

4.2 (3.8, 4.6)

4.3 (3.9, 4.7)

0.298

Chloride (mmol/L)

102 (98, 106)

103 (99, 107)

0.305

Calcium (mmol/L)

2.1 (1.9, 2.3)

2.0 (1.8, 2.2)

0.276

Glucose (mmol/L)

8.9 (6.2, 12.1)

9.1 (6.4, 12.3)

0.453

Hemoglobin (g/L)

92 (78, 105)

90 (76, 103)

0.387

Hematocrit (%)

28 (24, 32)

27 (23, 31)

0.415

White blood cell count (×10⁹/L)

11.2 (7.8, 15.6)

11.5 (8.0, 15.9)

0.362

Platelet count (×10⁹/L)

186 (122, 258)

182 (118, 252)

0.408

Activated clotting time (ACT, s)

182 (156, 214)

185 (158, 218)

0.327

Activated partial thromboplastin time (APTT, s)

48 (36, 62)

49 (37, 64)

0.351

International normalized ratio (INR)

1.4 (1.1, 1.7)

1.5 (1.2, 1.8)

0.289

Prothrombin time (PT, s)

16.2 (13.5, 19.8)

16.5 (13.8, 20.1)

0.302

Blood gas analysis, median (IQR)

pH

7.32 (7.25, 7.38)

7.31 (7.24, 7.37)

0.418

PaCO2 (mmHg)

42 (35, 50)

43 (36, 51)

0.374

PaO2/FiO2 ratio (mmHg)

186 (124, 258)

182 (120, 254)

0.425

Bicarbonate (mmol/L)

24 (21, 27)

23 (20, 26)

0.312

Base excess (mmol/L)

-2.1 (-5.2, 1.3)

-2.3 (-5.4, 1.1)

0.386

Anion gap (mmol/L)

12 (8, 16)

13 (9, 17)

0.297

Disease severity scores, median (IQR)

SOFA score

11 (8, 14)

12 (8, 15)

0.645

APS III score

52 (41, 63)

54 (43, 65)

0.512

LODS score

10 (7, 13)

11 (8, 14)

0.489

OASIS score

42 (33, 51)

44 (35, 53)

0.426

SIRS score

2 (1, 3)

2 (1, 3)

0.783

GCS score

13 (10, 15)

13 (10, 15)

0.815

MELD score

18 (12, 24)

19 (13, 25)

0.503

ECMO and treatment characteristics

ECMO mode, VV/VA, n

194 / 106

131 / 69

0.947

ECMO duration (h), median (IQR)

142 (96, 215)

138 (92, 207)

0.735

Vasopressor use, n (%)

242 (80.7)

158 (79.0)

0.672

Norepinephrine

218 (72.7)

142 (71.0)

0.689

Epinephrine

56 (18.7)

38 (19.0)

0.921

Dopamine

32 (10.7)

21 (10.5)

0.935

Dobutamine

28 (9.3)

19 (9.5)

0.927

Phenylephrine

18 (6.0)

12 (6.0)

1.000

CRRT use, n (%)

87 (29.0)

56 (28.0)

0.783

Mechanical ventilation, n (%)

268 (89.3)

178 (89.0)

0.915

Core research indicators, median (IQR)

ACT-CV (coefficient of variation)

0.28 (0.21, 0.36)

0.29 (0.22, 0.37)

0.681

APTT-CV (coefficient of variation)

0.24 (0.18, 0.33)

0.25 (0.19, 0.34)

0.702

Outcomes, n (%)

Hospital mortality

77 (25.7)

53 (26.5)

0.887

28-day mortality

82 (27.3)

55 (27.5)

0.952

Abbreviations: ACT, activated clotting time; ACT-CV, coefficient of variation of activated clotting time; APTT, activated partial thromboplastin time; APTT-CV, coefficient of variation of activated partial thromboplastin time; AG, anion gap; APS III, Acute Physiology Score III; CRRT, continuous renal replacement therapy; ECMO, extracorporeal membrane oxygenation; GCS, Glasgow Coma Scale; INR, International Normalized Ratio; LODS, Logistic Organ Dysfunction Score; LOS, length of hospital stay; MELD, Model for End-Stage Liver Disease; OASIS, Oxford Acute Severity of Illness Score; PaCO2, partial pressure of carbon dioxide; PaO2, partial pressure of oxygen; PaO2/FiO2, ratio of partial pressure of oxygen to fraction of inspired oxygen; PT, prothrombin time; SIRS, Systemic Inflammatory Response Syndrome; SOFA, Sequential Organ Failure Assessment; SpO2, peripheral blood oxygen saturation; WBC, white blood cell count; ICU, intensive care unit.
3.2. Variable Screening Via LASSO Cox Regression
LASSO penalized regression with optimal λ identified five variables with non-zero regression coefficients which summarized in Table 2 age (0.021049), ACT-CV (0.087521), APTT-CV (0.079164), lactate (0.054002), SOFA score (0.010851). All remaining covariates (ECMO runtime, ECMO mode, sex, creatinine, platelet, pH, total bilirubin) were eliminated with coefficients compressed to zero. These five indicators were retained for subsequent Cox regression analysis.
Table 2. LASSO regression coefficient table.

Regression coefficient

Age

0.021049

ACT-CV (coefficient of variation)

0.087521

APTT-CV (coefficient of variation)

0.079164

Lactate (mmol/L)

0.054002

SOFA score

0.010851

ECMO duration

0

ECMO mode (VV/VA)

0

Gender

0

Creatinine

0

Platelet count

0

pH

0

Total bilirubin

0

3.3. Independent Predictors of 28-Day In-Hospital Mortality
Univariate and multivariate Cox regression outcomes were presented in Table 3. In fully adjusted multivariate models, higher ACT-CV (HR=2.875, 95%CI 1.692–4.891, P<0.001) and APTT-CV (HR=2.630, 95%CI 1.547–4.471, P<0.001) remained powerful independent risk factors for 28-day mortality, alongside advancing age, elevated lactate and higher baseline SOFA score.
Tertile stratification demonstrated a clear positive dose-response association between coagulation variability and death risk. Compared with the low-fluctuation reference group, medium ACT-CV carried a 72.4% mortality hazard increase (HR=1.724, P=0.045), while high ACT-CV was associated with over three-fold mortality risk (HR=3.468, P<0.001). Similarly, high APTT-CV (>0.30) significantly elevated 28-day death risk (HR=3.105, P<0.001), whereas medium APTT-CV showed marginal statistical significance (HR=1.681, P=0.056).
Subgroup interaction analysis showed that the prognostic impact of elevated ACT-CV was consistent across age strata (≤60 vs >60 years), ECMO modes (VV vs VA), and lactate subgroups (≤2 vs >2 mmol/L). All interaction P-values exceeded 0.05, confirming the stable predictive value of coagulation variability regardless of baseline patient conditions.
Table 3. Univariate and multivariate Cox regression analysis table.

Variables

Univariate analysisHR (95% CI)

P value

Multivariate analysisHR (95% CI)

P value

Age

1.024 (1.003–1.046)

0.025

1.021 (1.001–1.042)

0.038

ACT-CV

3.126 (1.874–5.213)

<0.001

2.875 (1.692–4.891)

<0.001

APTT-CV

2.943 (1.761–4.920)

<0.001

2.630 (1.547–4.471)

<0.001

Lactate

1.215 (1.084–1.362)

<0.001

1.182 (1.053–1.326)

0.004

SOFA score

1.107 (1.032–1.188)

0.004

1.085 (1.010–1.166)

0.025

Univariate and multivariate Cox regression analysis of prognostic factors for 28-day mortality in the derivation cohort. HR, hazard ratio; CI, confidence interval; ACT-CV, coefficient of variation of activated clotting time; APTT-CV, coefficient of variation of activated partial thromboplastin time; SOFA, Sequential Organ Failure Assessment. Variables retained after LASSO-Cox screening were entered into the multivariate Cox regression model.
Table 4. Tertile stratified Cox regression table.

Groups

HR (95% CI)

P value

ACT-CV

Low ACT-CV (<0.23)

Reference

Intermediate ACT-CV (0.23–0.33)

1.724 (1.012–2.937)

0.045

High ACT-CV (>0.33)

3.468 (2.016–5.964)

<0.001

APTT-CV

Low APTT-CV (<0.20)

Reference

Intermediate APTT-CV (0.20–0.30)

1.681 (0.986–2.867)

0.056

High APTT-CV (>0.30)

3.105 (1.822–5.290)

<0.001

Abbreviations: HR, hazard ratio; CI, confidence interval; ACT-CV, coefficient of variation of activated clotting time; APTT-CV, coefficient of variation of activated partial thromboplastin time.
Table 5. Subgroup interaction analysis table.

Subgroup stratification

HR (95% CI) of high ACT-CV

P for interaction

Age ≤ 60 years

2.412 (1.105–5.263)

0.276

Age > 60 years

3.084 (1.643–5.786)

0.276

VV-ECMO mode

2.761 (1.482–5.143)

0.413

VA-ECMO mode

3.015 (1.336–6.792)

0.413

Lactate ≤ 2 mmol/L

2.350 (1.044–5.293)

0.351

Lactate > 2 mmol/L

3.227 (1.751–5.944)

0.351

Abbreviations: HR, hazard ratio; CI, confidence interval; ACT-CV, coefficient of variation of activated clotting time; VV-ECMO, venovenous extracorporeal membrane oxygenation; VA-ECMO, venoarterial extracorporeal membrane oxygenation.
Table 6. Stratified Cox regression for APTT-CV.

Groups

HR (95% CI)

P value

Low APTT-CV (<0.20)

Reference

Intermediate APTT-CV (0.20–0.30)

1.681 (0.986–2.867)

0.056

High APTT-CV (>0.30)

3.105 (1.822–5.290)

<0.001

Abbreviations: HR, hazard ratio; CI, confidence interval; APTT-CV, coefficient of variation of activated partial thromboplastin time.
Table 7. Subgroup interaction analysis for high APTT-CV.

Subgroup stratification

HR (95% CI) of high APTT-CV

P for interaction

Age ≤ 60 years

2.297 (1.062–4.966)

0.291

Age > 60 years

2.951 (1.572–5.537)

0.291

VV-ECMO mode

2.643 (1.412–4.945)

0.447

VA-ECMO mode

2.902 (1.283–6.562)

0.447

Lactate ≤ 2 mmol/L

2.284 (1.016–5.132)

0.365

Lactate > 2 mmol/L

3.096 (1.682–5.698)

0.365

Abbreviations: HR, hazard ratio; CI, confidence interval; APTT-CV, coefficient of variation of activated partial thromboplastin time; VV-ECMO, venovenous extracorporeal membrane oxygenation; VA-ECMO, venoarterial extracorporeal membrane oxygenation.
3.4. Survival Differences Across Coagulation Variability Tertiles
Kaplan-Meier survival curves for ACT-CV and APTT-CV tertiles were shown in Figure 2. Log-rank tests revealed significant survival disparities between low, medium and high fluctuation groups (all P<0.001). For ACT-CV groups, 28-day survival rates were 78% (low), 56% (medium), and only 24% (high). For APTT-CV groups, corresponding survival proportions were 77%, 55% and 23%. Patients with severe intra-individual coagulation fluctuation exhibited steep survival decline within the first two weeks of ECMO support.
Figure 2. Kaplan Meier survival curves for 28 day mortality stratified by ACT CV tertiles. Kaplan Meier curves showing 28 day survival among ECMO patients stratified by low, intermediate and high ACT CV tertiles. Log rank test was used for group comparison. Patients in the high ACT CV group exhibited substantially poorer survival outcomes. ACT CV, coefficient of variation of activated clotting time.
3.5. Nomogram Construction and Model Performance
3.5.1. Nomogram Visualization
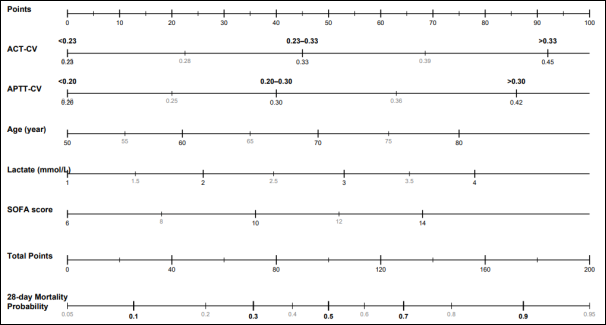
A quantitative nomogram integrating age, lactate, SOFA score, ACT-CV and APTT-CV was constructed in Figure 3. Clinicians can sum individual point scores corresponding to each variable axis and read the predicted 28-day in-hospital mortality probability from the total score scale, enabling rapid bedside risk stratification without complex calculation.as shown in Figure 3.
Figure 3. The prediction model was developed based on Cox proportional hazards regression and visualized as a nomogram incorporating five independent prognostic factors: age, lactate, SOFA score, ACT CV, and APTT CV for 28 day mortality among patients receiving ECMO support.
3.5.2. Discrimination (ROC AUC)
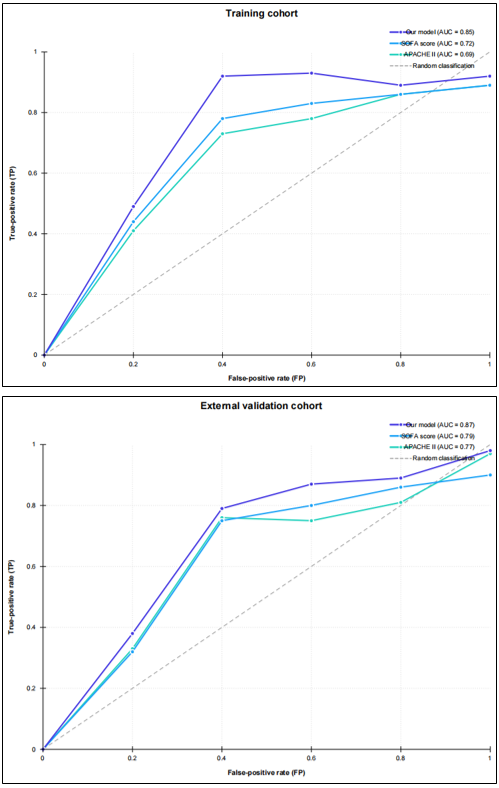
In the MIMIC-IV derivation cohort, the nomogram achieved an AUC of 0.85, superior to SOFA score (AUC=0.72) and APACHE II (AUC=0.69). In the independent single-center validation cohort, the nomogram retained robust discrimination with AUC=0.81, still outperforming SOFA (0.69) and APACHE II (0.67).as shown in Figure 4.
Figure 4. Receiver operating characteristic (ROC) curves of predictive models for 28 day mortality risk in patients receiving extracorporeal membrane oxygenation. (A) ROC curve of the nomogram derived from the training cohort. (B) ROC curve of the nomogram in the external validation cohort (SOFA score and APACHE Ⅱ score were applied as reference models).
3.5.3. Calibration Performance
Calibration curves of both derivation and validation cohorts showed nearly complete overlap between model-predicted mortality risk and actual observed death proportion, tightly fitting the ideal reference diagonal line in Figure 5. No obvious overestimation or underestimation bias was detected across all risk ranges, indicating excellent calibration consistency.
Figure 5. Calibration and decision curve analysis (DCA) curves of predictive models for 28 day mortality risk in patients receiving extracorporeal membrane oxygenation. (A) Calibration curves for predicting 28 day mortality in the training cohort. (B) External validation of calibration curves for predicting 28 day mortality in the external validation cohort. (C) Decision curve analysis (DCA) of the nomogram for predicting 28 day mortality in the training cohort. (D) DCA of the nomogram for predicting 28 day mortality in the external validation cohort (SOFA score and APACHE Ⅱ score were used as reference models).

3.5.4. Decision Curve Analysis (DCA)
DCA curves for two cohorts were displayed in Figure 5. The novel nomogram curve was persistently positioned above the SOFA score curve and the "no intervention" reference line within mainstream clinical risk thresholds (0–0.6). This demonstrated that applying our nomogram to guide clinical anticoagulation and supportive interventions generated greater net clinical benefit compared with traditional organ dysfunction scoring systems in both database and real-world patient populations.
4. Discussion
This dual-cohort prediction model study produced three core findings aligned with and extending the conclusions of ELSO registry research and prior APTT longitudinal ECMO analysis . First, intra-individual ACT and APTT variability are independent, dose-dependent predictors of 28-day in-hospital mortality for ECMO patients, even after full adjustment for age, lactate and SOFA score. Second, the visual nomogram combining dual coagulation fluctuation markers and routine clinical indices demonstrated stable, superior prognostic performance in internal and external validation cohorts. Third, the model provided higher net clinical benefit than conventional critical illness scores, supporting its practical value for bedside risk stratification and individualized anticoagulation management .
4.1. Clinical Interpretation of ACT/APTT Variability as Mortality Predictors
The ELSO registry analysis confirmed that bleeding complications are the primary driver of elevated ECMO in-hospital mortality, yet the registry lacked serial coagulation laboratory data to explore how unstable anticoagulation monitoring correlates with adverse outcomes . A subsequent single-center longitudinal study addressed this gap by proving dynamic APTT trajectory outperforms single static values for hemorrhage and death prediction, but the study only evaluated APTT without incorporating ACT—the most commonly used rapid coagulation test in ECMO wards . Our research advanced this field by simultaneously calculating ACT-CV and APTT-CV to comprehensively reflect real-time coagulation homeostasis .
Mechanistically, greater intra-individual ACT/APTT variability may reflect instability of coagulation homeostasis during ECMO support. Anticoagulation and coagulation status in ECMO patients are influenced by multiple factors rather than heparin exposure alone, including the extracorporeal circuit, underlying coagulopathy, inflammation, and anticoagulation therapy . ACT and APTT measurements are also affected by patient- and assay-related factors; for example, ACT may be influenced by hemodilution, platelet dysfunction, anemia, hypofibrinogenemia, and coagulation factor deficiencies, whereas APTT may be affected by hematocrit, acute-phase reactants, and abnormalities in coagulation factors . Therefore, marked ACT/APTT variability may reflect the combined effects of anticoagulation and changes in the patient's coagulation condition rather than an isolated abnormal laboratory value. Repeated fluctuations in coagulation status may, in turn, indicate greater susceptibility to bleeding and thrombotic complications, which have been shown to be associated with increased in-hospital mortality in ECMO patients . Our tertile analysis supports this interpretation, as increasing ACT-CV and APTT-CV were associated with progressively higher mortality risk and poorer 28-day survival. However, because the present study was observational, the biological pathways underlying this association cannot be directly established and require further prospective investigation.
4.2. Advantages of the Dual-cohort Nomogram Over Traditional Scoring Tools
Existing severity scores (SOFA, APACHE II) quantify organ failure but ignore dynamic anticoagulation status, a core ECMO-specific risk dimension. Our LASSO-selected nomogram innovatively embedded ACT-CV and APTT-CV alongside standard clinical markers, capturing both baseline organ dysfunction and real-time coagulation stability. Dual-cohort validation design (public database derivation + single-center real-world testing) followed rigorous TRIPOD standards, overcoming the limitation of single-center datasets in prior coagulation fluctuation research .
Multi-dimensional performance verification fully validated model reliability: discrimination AUC above 0.8 in both cohorts indicated strong ability to distinguish survivors from non-survivors; tight calibration curves eliminated systematic predictive bias; DCA results confirmed tangible clinical value—clinicians using this nomogram to adjust anticoagulation and intensify monitoring will gain more patient survival benefit than relying solely on SOFA or APACHE II scores. Unlike complex longitudinal joint-survival statistical models that require specialized software to analyze serial lab trajectories, the nomogram delivers intuitive, calculation-free risk assessment suitable for routine ICU clinical workflow .
4.3. Clinical Implications for ECMO Anticoagulation Management
Our study delivers two actionable clinical recommendations. First, ICU staff should abandon exclusive reliance on single-timepoint ACT/APTT measurements. Serial coagulation records should be aggregated to calculate CV values to quantify fluctuation magnitude during daily rounds . Patients with medium or high ACT/APTT variability should be categorized as high-risk and scheduled for intensified anticoagulation titration, frequent organ function re-evaluation and enhanced bleeding/thrombosis surveillance. Second, the validated nomogram can be integrated into electronic medical record systems to automatically compute 28-day mortality risk upon input of routine lab data, enabling standardized, objective early risk stratification for all ECMO admissions. This tool complements ELSO’s call for personalized ECMO anticoagulation strategies tailored to individual patient risk profiles .
4.4. Study Limitations
Several limitations must be acknowledged, consistent with the discussion framework of ELSO registry and single-center ECMO coagulation research:
1) Retrospective design: inherent selection bias cannot be fully eliminated despite multiple imputation and multivariate adjustment; prospective multi-center cohorts are required to externally replicate our findings.
2) Restricted external validation scope: the validation cohort was sourced from a single tertiary ICU, and further cross-regional multi-center testing is necessary to confirm nationwide generalizability.
3) Short-term primary endpoint: only 28-day in-hospital mortality was analyzed; long-term post-discharge survival data were unavailable to evaluate the lasting prognostic impact of coagulation variability.
4) Coagulation marker limitation: this study focused on routine ACT and APTT testing, without simultaneous comparison with viscoelastic assays (thromboelastography, TEG) to clarify the relative predictive efficacy of different coagulation monitoring modalities.
4.5. Future Research Directions
Based on the present results, three research directions are planned: First, launch a multi-center prospective ECMO cohort study to further validate the nomogram’s predictive stability across diverse hospital settings. Second, explore the underlying inflammatory and endothelial biological mechanisms linking coagulation fluctuation to multi-organ failure and death. Third, integrate the nomogram algorithm into wearable monitoring devices supported by our institutional patents, developing portable bedside tools for real-time automated ECMO risk evaluation to promote clinical translational application.
5. Conclusions
Intra-individual variability of serial ACT and APTT measurements are independent, dose-response prognostic markers of 28-day in-hospital mortality among adult ECMO patients. The visual nomogram constructed combining coagulation fluctuation indicators, age, lactate and SOFA score achieves superior discrimination, favorable calibration and greater net clinical benefit compared with conventional critical illness scoring systems in both MIMIC-IV derivation and single-center external validation cohorts. Routine quantification of ACT-CV and APTT-CV provides a novel, low-cost strategy to identify high-risk ECMO recipients early and guide personalized anticoagulation management.
Abbreviations

ECMO

Extracorporeal Membrane Oxygenation

VV-ECMO

Venovenous Extracorporeal Membrane Oxygenation

VA-ECMO

Venoarterial Extracorporeal Membrane Oxygenation

ACT

Activated Clotting Time

APTT

Activated Partial Thromboplastin Time

CV

Coefficient of Variation

ACT-CV

Coefficient of Variation of Activated Clotting Time

APTT-CV

Coefficient of Variation of Activated Partial Thromboplastin Time

BTEs

Bleeding/Thrombotic Events

ELSO

Extracorporeal Life Support Organization

LASSO

Least Absolute Shrinkage and Selection Operator

SOFA

Sequential Organ Failure Assessment

APACHE II

Acute Physiology and Chronic Health Evaluation II

DCA

Decision Curve Analysis

MIMIC-IV

Medical Information Mart for Intensive Care IV

Author Contributions
Shihui Ma: Conceptualization, Data curation, Formal Analysis, Methodology, Visualization, Writing – original draft
Mei Feng: Data curation, Investigation, Validation, Writing – review & editing
Jingru Lan: Data curation, Investigation, Validation, Writing – review & editing
Manli Liu: Investigation, Resources, Writing – review & editing
Qingran Lin: Conceptualization, Methodology, Project administration, Supervision, Writing – review & editing
Conflicts of Interest
The authors declare no conflicts of interest.
References
[1] Nunez JI, Gosling AF, O’Gara B, et al. Bleeding and thrombotic events in adults supported with venovenous extracorporeal membrane oxygenation: An ELSO registry analysis. Intensive Care Med. 2022; 48(2): 213–224.
[2] Helms J, Frere C, Thiele T, et al. Anticoagulation in adult patients supported with extracorporeal membrane oxygenation: Guidance from the scientific and standardization committees on perioperative and critical care haemostasis and thrombosis of the international society on thrombosis and haemostasis. J Thromb Haemost. 2023; 21(2): 373–396.
[3] Weber CF, Zacharowski K, Calatzis A, and Lindner ML. Monitoring unfractionated heparin in ECMO and cardiac surgery: The search for a valid reference standard. Front Med (Lausanne). 2026; 13: 1818646.
[4] Xu Enhui, Sun Qi, Lu Juan, Xiong Ying, Wei Xinguang, and Wei Xinguang. Recent advances and future perspectives in anticoagulation management for extracorporeal membrane oxygenation. Chinese Journal of Extracorporeal Life Support. 2025; 23(2): 176–180.
[5] Davidson S. Interpretation of coagulation laboratory tests for patients on ECMO. Int J Lab Hematol. 2024; 46(4): 606–612.
[6] Malik MI, Aboelnazar NS, Rheault-Henry M, Vo TX, and Nagpal AD. Cumulative elevation of aPTT predicts time to major bleeding and death in ECMO: A joint longitudinal-survival model. Perfusion. 2026;: 2676591251412301.
[7] Ranzani OT, Singer M, and Moreno RP. Clarifying the SOFA-2 score-reply. JAMA. 2026; 335(15): 1362–1363.
[8] Marget MJ, Dunn R, and Morgan CL. Association of APACHE-II scores with 30-day mortality after tracheostomy: A retrospective study. Laryngoscope. 2023; 133(2): 273–278.
[9] Lei J, Zhai J, Zhang Y, Qi J, and Sun C. Supervised machine learning models for predicting sepsis-associated liver injury in patients with sepsis: Development and validation study based on a multicenter cohort study. J Med Internet Res. 2025; 27: e66733.
[10] Zou Chen. The Impact of Different Anticoagulation Timing Strategies on Prognosis and Complications in ECMO-Treated Patients. 2025.
[11] Qian S, Li P, Hou X, and Dong N. Development and internal validation of the PROFIT and POSITIVE prognostic nomograms for patients undergoing VA-ECMO therapy. Sci Rep. 2025; 15(1): 20573.
[12] Yang Yang, Zhu Yi, and Wu Hao. A nomogram⁃based prediction model for clinical mortality risk in VA⁃ECMO patients. Journal of Nanjing Medical University(Natural Sciences). 2026; 46(3): 425–434.
[13] Xu Dacai, Ding Yao, Zhang Aijuan, et al. Best Evidence Summary for Anticoagulation Management in Adults Undergoing Extracorporeal Membrane Oxygenation. Chinese General Practice Nursing. 2025; 23(17): 3367–3372.
[14] Barbaro RP, MacLaren G, Boonstra PS, et al. Extracorporeal membrane oxygenation for COVID-19: Evolving outcomes from the international extracorporeal life support organization registry. Lancet. 2021; 398(10307): 1230–1238.
[15] Teng Yuan. Effects of Different Anticoagulation Monitoring Indexes on Anticoagulation and Clinical Prognosis of Adult Veno-Arterial Extracorporeal Membrane Oxygenation. 2021.
[16] McMichael ABV, Ryerson LM, Ratano D, Fan E, Faraoni D, and Annich GM. 2021 ELSO adult and pediatric anticoagulation guidelines. ASAIO J. 2022; 68(3): 303–310.
[17] Zeibi Shirejini S, Carberry J, McQuilten ZK, Burrell AJC, Gregory SD, and Hagemeyer CE. Current and future strategies to monitor and manage coagulation in ECMO patients. Thromb J. 2023; 21(1): 11.
[18] Noitz M, Jenner D, Brooks R, et al. ECMO decannulation is associated with dynamic changes in coagulation profiles: An exploratory, nested cohort study. BMC Anesthesiol. 2026; 26(1): 137.
[19] Yuan Jiankai, Duan Hongwei, and Tang Yishu. Construction of a nomogram prediction model for thrombosis risk in patients receiving ECMO supportive treatment. Journal of Modern Medicine & Health. 2026; 42(3): 597–603.
[20] Zhao Qi, Chu Minjuan, and Ji Xueli. Application of a Multivariable Logistic Regression-Based Nomogram for Predicting Mortality Risk in Patients Following Extracorporeal Membrane Oxygenation. Shaanxi Medical Journal. 2026; 55(1): 68–72.
[21] Guo Lanqi, Liu Songqiao, Chang Wei, Pan Chun, and Zheng Yishan. Analysis of Complications and Their Prognostic Associations in Patients Undergoing Extracorporeal Membrane Oxygenation. Modern Medical Journal. 2022; 50(10): 1227–1231.
Cite This Article
  • APA Style

    Ma, S., Feng, M., Lan, J., Liu, M., Lin, Q. (2026). ACT and APTT Variability as Prognostic Markers for 28-Day In-Hospital Mortality in ECMO Patients: Development and External Validation of a Nomogram. Cardiology and Cardiovascular Research, 10(3), 63-77. https://doi.org/10.11648/j.ccr.20261003.16

    Copy | Download

    ACS Style

    Ma, S.; Feng, M.; Lan, J.; Liu, M.; Lin, Q. ACT and APTT Variability as Prognostic Markers for 28-Day In-Hospital Mortality in ECMO Patients: Development and External Validation of a Nomogram. Cardiol. Cardiovasc. Res. 2026, 10(3), 63-77. doi: 10.11648/j.ccr.20261003.16

    Copy | Download

    AMA Style

    Ma S, Feng M, Lan J, Liu M, Lin Q. ACT and APTT Variability as Prognostic Markers for 28-Day In-Hospital Mortality in ECMO Patients: Development and External Validation of a Nomogram. Cardiol Cardiovasc Res. 2026;10(3):63-77. doi: 10.11648/j.ccr.20261003.16

    Copy | Download

  • @article{10.11648/j.ccr.20261003.16,
      author = {Shihui Ma and Mei Feng and Jingru Lan and Manli Liu and Qingran Lin},
      title = {ACT and APTT Variability as Prognostic Markers for 28-Day In-Hospital Mortality in ECMO Patients: Development and External Validation of a Nomogram},
      journal = {Cardiology and Cardiovascular Research},
      volume = {10},
      number = {3},
      pages = {63-77},
      doi = {10.11648/j.ccr.20261003.16},
      url = {https://doi.org/10.11648/j.ccr.20261003.16},
      eprint = {https://article.sciencepublishinggroup.com/pdf/10.11648.j.ccr.20261003.16},
      abstract = {Venovenous and venoarterial extracorporeal membrane oxygenation (ECMO) provides life support for patients with refractory cardiopulmonary failure, but bleeding and thrombotic complications remain major causes of mortality. Conventional monitoring based on single activated clotting time (ACT) and activated partial thromboplastin time (APTT) measurements may not adequately capture intra-individual coagulation fluctuations. Previous longitudinal work linked APTT variability with bleeding and mortality, but ACT variability has rarely been evaluated concurrently. This dual-cohort retrospective study evaluated the prognostic value of ACT and APTT variability for 28-day in-hospital mortality and developed an externally validated nomogram. The derivation cohort included 300 patients from the MIMIC-IV database, and the external validation cohort included 200 patients from our ICU. Intra-individual coefficients of variation (CVs) of serial ACT and APTT measurements during ECMO support were calculated. Candidate predictors were screened using LASSO Cox regression and evaluated by Cox proportional hazards regression. Kaplan–Meier analysis compared survival across ACT-CV and APTT-CV tertiles, and model performance was assessed by discrimination, calibration, and decision curve analysis. LASSO identified age, ACT-CV, APTT-CV, lactate, and SOFA score as candidate predictors. Multivariate Cox regression showed that elevated ACT-CV (HR=2.875, 95% CI 1.692–4.891, P<0.001) and APTT-CV (HR=2.630, 95% CI 1.547–4.471, P<0.001) were independent predictors of 28-day mortality. Mortality risk increased progressively across higher ACT-CV and APTT-CV tertiles, with significantly poorer survival in patients with greater coagulation variability (all log-rank P<0.001). The five-variable nomogram achieved AUCs of 0.85 and 0.81 in the derivation and validation cohorts, respectively, outperforming SOFA and APACHE II scores, with favorable calibration and greater clinical net benefit. Intra-individual ACT and APTT variability may therefore provide accessible prognostic information for early risk stratification and individualized anticoagulation management in ECMO patients.},
     year = {2026}
    }
    

    Copy | Download

  • TY  - JOUR
    T1  - ACT and APTT Variability as Prognostic Markers for 28-Day In-Hospital Mortality in ECMO Patients: Development and External Validation of a Nomogram
    AU  - Shihui Ma
    AU  - Mei Feng
    AU  - Jingru Lan
    AU  - Manli Liu
    AU  - Qingran Lin
    Y1  - 2026/09/15
    PY  - 2026
    N1  - https://doi.org/10.11648/j.ccr.20261003.16
    DO  - 10.11648/j.ccr.20261003.16
    T2  - Cardiology and Cardiovascular Research
    JF  - Cardiology and Cardiovascular Research
    JO  - Cardiology and Cardiovascular Research
    SP  - 63
    EP  - 77
    PB  - Science Publishing Group
    SN  - 2578-8914
    UR  - https://doi.org/10.11648/j.ccr.20261003.16
    AB  - Venovenous and venoarterial extracorporeal membrane oxygenation (ECMO) provides life support for patients with refractory cardiopulmonary failure, but bleeding and thrombotic complications remain major causes of mortality. Conventional monitoring based on single activated clotting time (ACT) and activated partial thromboplastin time (APTT) measurements may not adequately capture intra-individual coagulation fluctuations. Previous longitudinal work linked APTT variability with bleeding and mortality, but ACT variability has rarely been evaluated concurrently. This dual-cohort retrospective study evaluated the prognostic value of ACT and APTT variability for 28-day in-hospital mortality and developed an externally validated nomogram. The derivation cohort included 300 patients from the MIMIC-IV database, and the external validation cohort included 200 patients from our ICU. Intra-individual coefficients of variation (CVs) of serial ACT and APTT measurements during ECMO support were calculated. Candidate predictors were screened using LASSO Cox regression and evaluated by Cox proportional hazards regression. Kaplan–Meier analysis compared survival across ACT-CV and APTT-CV tertiles, and model performance was assessed by discrimination, calibration, and decision curve analysis. LASSO identified age, ACT-CV, APTT-CV, lactate, and SOFA score as candidate predictors. Multivariate Cox regression showed that elevated ACT-CV (HR=2.875, 95% CI 1.692–4.891, P<0.001) and APTT-CV (HR=2.630, 95% CI 1.547–4.471, P<0.001) were independent predictors of 28-day mortality. Mortality risk increased progressively across higher ACT-CV and APTT-CV tertiles, with significantly poorer survival in patients with greater coagulation variability (all log-rank P<0.001). The five-variable nomogram achieved AUCs of 0.85 and 0.81 in the derivation and validation cohorts, respectively, outperforming SOFA and APACHE II scores, with favorable calibration and greater clinical net benefit. Intra-individual ACT and APTT variability may therefore provide accessible prognostic information for early risk stratification and individualized anticoagulation management in ECMO patients.
    VL  - 10
    IS  - 3
    ER  - 

    Copy | Download

Author Information
  • Abstract
  • Keywords
  • Document Sections

    1. 1. Introduction
    2. 2. Materials and Methods
    3. 3. Results
    4. 4. Discussion
    5. 5. Conclusions
    Show Full Outline
  • Abbreviations
  • Author Contributions
  • Conflicts of Interest
  • References
  • Cite This Article
  • Author Information