Abstract
Background: The COVID-19 pandemic and nationwide lockdown in India during 2020, led to an unprecedented decrease in anthropogenic activities, offering a rare chance to assess the effect of anthropogenic activities on ambient air quality. Objective: To understand the impact of COVID-19 lockdown on the main air pollutants of Haryana, India and to compare the air quality condition before, during, and after the COVID-19 lockdown. Methods: Air quality parameters: PM2.5, PM10, NOx, CO and O₃ were obtained from Continuous Ambient Air Quality Monitoring Stations (CAAQMS) operated by Central Pollution Control Board (CPCB). Data of ten parliamentary constituencies were taken from across Haryana and analysed in the time period of 2019-2022. Pollutant levels in 2020 during four lockdown periods were compared to those in 2019, 2021 and 2022. Average concentrations were computed daily and temporal trends were analyzed to detect changes in pollutant concentrations. The results in this thesis showed significant reductions in PM2.5, PM10, NOₓ and CO levels during the lockdown period. During the first phase of the lockdown, a sharp drop in traffic, industry activity and construction, led to a decrease in PM2.5 concentrations of almost 50%, and in NOₓ levels of more than 60%. Similarly, there were substantial decreases of PM10 and CO from pre-lockdown periods. The behavior of the ozone concentration varied significantly as a result of some complex photochemical processes, involving the emissions of precursors and the atmospheric conditions. But concentrations increased slowly over the next few years following the pandemic (2021-2022) towards pre-pandemic concentrations. Conclusion: The study clearly shows that anthropogenic activities have a significant impact on the air quality in Haryana. The rebound in pollutant concentrations after the lockdown shows that sustainable long-term strategies for air pollution control are necessary, such as developing clean transportation systems, setting tighter limits on industrial emissions, and improving urban planning Solutions.
Keywords
Air Quality, COVID-19 Lockdown, Haryana, PM2.5, PM10, NOx, O3, CO
1. Introduction
Air pollution is an important environmental concern that exists across the world and adversely affects both humans and the ecosystem. In India, the growth of the city and industry along with the increase in the number of people has caused the deterioration of air quality in many areas
| [1] | Saxena, V. (2025). Water quality, air pollution, and climate change: investigating the environmental impacts of industrialization and urbanization. Water, Air, & Soil Pollution, 236(2), 73. https://doi.org/10.1007/s11270-024-07702-4 |
[1]
. Some of the important air pollutants include particulates (PM
2.5 and PM
10), nitrogen oxides (NOx), carbon monoxide (CO), and ground level ozone (O
3) which affect the human health and the environment
| [2] | Aljafen, B. N., Shaikh, N., AlKhalifah, J. M., & Meo, S. A. (2025). Effect of environmental pollutants particulate matter (PM2.5, PM10), nitrogen dioxide (NO2), sulfur dioxide (SO2), carbon monoxide (CO) and ground level ozone (O3) on epilepsy. BMC Neurology, 25(1), 133.
https://doi.org/10.1186/s12883-025-04142-3 |
[2]
.
Haryana in the northern part of India is often exposed to low air quality because of its close location to NCR, dense population of automobiles, industrial emissions, and burning of agricultural wastes
| [3] | Jethva, H., Torres, O., Field, R. D., Lyapustin, A., Gautam, R., & Kayetha, V. (2019). Connecting crop productivity, residue fires, and air quality over northern India. Scientific Reports, 9, 16594. https://doi.org/10.1038/s41598-019-52799-x |
[3]
. These aspects have led to high concentration levels of particulate and gaseous pollutants in this area.
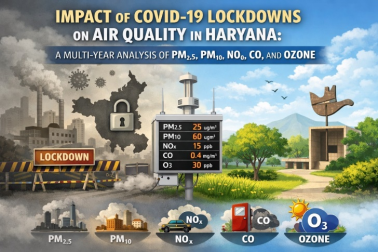
Figure 1. Impact of COVID-19 Lockdowns on Air Quality in Haryana – A Comparative Illustration of Key Pollutants (PM2.5, PM10, NOx, CO, and O3).
In early 2020, the COVID-19 pandemic led to the implementation of a strict nationwide lockdown in India to control the spread of the virus. Although primarily a public health measure, the lockdown provided a unique opportunity to assess the environmental impacts of a substantial reduction in anthropogenic activities
| [4] | Loh, H. C., Looi, I., Ch’ng, A. S. H., Goh, K. W., Ming, L. C., & Ang, K. H. (2022). Positive global environmental impacts of the COVID-19 pandemic lockdown: a review. GeoJournal, 87(5), 4425–4437.
https://doi.org/10.1007/s10708-021-10475-6 |
| [7] | Jain, S., & Sharma, T. (2020). Social and travel lockdown impact considering coronavirus disease (COVID-19) on air quality in megacities of India: Present benefits, future challenges and way forward. Aerosol and Air Quality Research, 20, 1222–1236. https://doi.org/10.4209/aaqr.2020.04.0171 |
| [8] | Mahato, S., Pal, S., & Ghosh, K. G. (2020). Effect of lockdown amid COVID-19 pandemic on air quality of the megacity Delhi, India. Science of the Total Environment, 730, 139086.
https://doi.org/10.1016/j.scitotenv.2020.139086 |
[4, 7, 8]
. The suspension of industrial operations, transportation, and construction activities resulted in a noticeable decline in air pollutant concentrations across several regions of the country
| [5] | Sharma, S., Zhang, M., Anshika, Gao, J., Zhang, H., & Kota, S. H. (2020). Effect of restricted emissions during COVID-19 on air quality in India. Science of the Total Environment, 728, 138878. https://doi.org/10.1016/j.scitotenv.2020.138878 |
| [6] | Bedi, J. S., Dhaka, P., Vijay, D., Aulakh, R. S., & Gill, J. P. S. (2020). Assessment of air quality changes in the four metropolitan cities of India during COVID-19 pandemic lockdown. Aerosol and Air Quality Research, 20(10), 2062–2070.
https://doi.org/10.4209/aaqr.2020.05.0209 |
| [9] | Singh, V., Singh, S., Biswal, A., Kesarkar, A. P., Mor, S., & Tiwari, S. (2020). Diurnal and temporal changes in air pollution during COVID-19 strict lockdown over different regions of India. Environmental Pollution, 266, 115368.
https://doi.org/10.1016/j.envpol.2020.115368 |
| [10] | Sathe, Y., Gupta, P., Bawase, M., Lamsal, L., Patadia, F., & Thipse, S. (2021). Surface and satellite observations of air pollution in India during COVID-19 lockdown: Implication to air quality. Sustainable Cities and Society, 66, 102688.
https://doi.org/10.1016/j.scs.2020.102688 |
[5, 6, 9, 10]
. Significant reductions in particulate matter and nitrogen oxides were reported in major metropolitan cities such as Delhi, Mumbai, and Bengaluru during the lockdown period
| [5] | Sharma, S., Zhang, M., Anshika, Gao, J., Zhang, H., & Kota, S. H. (2020). Effect of restricted emissions during COVID-19 on air quality in India. Science of the Total Environment, 728, 138878. https://doi.org/10.1016/j.scitotenv.2020.138878 |
| [6] | Bedi, J. S., Dhaka, P., Vijay, D., Aulakh, R. S., & Gill, J. P. S. (2020). Assessment of air quality changes in the four metropolitan cities of India during COVID-19 pandemic lockdown. Aerosol and Air Quality Research, 20(10), 2062–2070.
https://doi.org/10.4209/aaqr.2020.05.0209 |
| [9] | Singh, V., Singh, S., Biswal, A., Kesarkar, A. P., Mor, S., & Tiwari, S. (2020). Diurnal and temporal changes in air pollution during COVID-19 strict lockdown over different regions of India. Environmental Pollution, 266, 115368.
https://doi.org/10.1016/j.envpol.2020.115368 |
| [11] | Saxena, A., & Raj, S. (2021). Impact of lockdown during COVID-19 pandemic on the air quality of North Indian cities. Urban Climate, 35, 100754.
https://doi.org/10.1016/j.uclim.2020.100754 |
| [12] | Rathore, D. S., Nagda, C., Shaktawat, B. S., Kain, T., Chouhan, C. S., Purohit, R., Harish, Khangarot, R. K., Nagda, G., & Jhala, L. S. (2021). COVID-19 lockdown: a boon in boosting the air quality of major Indian Metropolitan Cities. Aerobiologia, 37(1), 79–103. https://doi.org/10.1007/s10453-020-09673-5 |
[5, 6, 9, 11, 12]
. Similar improvements in air quality during COVID-19 lockdowns were reported across several major cities worldwide
.
However, most previous studies have focused on large metropolitan areas, with limited attention given to semi-urban and mixed land-use regions such as Haryana. Therefore, there is a need for a detailed regional assessment to understand air quality variations in such areas.
The present study aims to evaluate the temporal variations in major air pollutants (PM2.5, PM10, NOx, CO, and O3) in Haryana during the COVID-19 lockdown period in 2020. The analysis is carried out across four lockdown phases (25 March–31 May 2020) and compared with pre-lockdown (2019) and post-lockdown periods (2021–2022) to understand long-term trends in air quality.
Air quality data for ten parliamentary constituencies of Haryana were obtained from the Central Pollution Control Board (CPCB). In cases where data from a primary monitoring station were unavailable, data from nearby stations within the same region were used. The data were recorded at 15-minute intervals and averaged to daily values to ensure consistency in temporal analysis.
The findings of this study provide insights into the impact of reduced anthropogenic activities on air quality and can support policymakers and planners in developing effective long-term strategies for air pollution control.
2. Material and Method
2.1. Study Area and Data Description
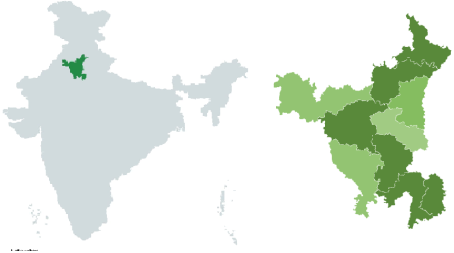
Figure 2. Study area map of India and Haryana.
The present study focuses on Haryana, a state in northern India with a latitude of 27.39° N to 30.35° N and longitude of 74.28° E to 77.36° E. Haryana shares boundaries with Punjab and Himachal Pradesh to the North, Rajasthan to the West and south, Uttar Pradesh and Delhi to the east. Due to its proximity to the National Capital Territory (NCT) of Delhi, Haryana has a massive influence on the air quality of the Indo-Gangetic Plain that is one of the most polluted regions in the world. Haryana is an urban-industrial-agricultural mixed state, and its growth is rapid. The leading business and industry hubs are the major cities of Gurugram, Faridabad, Panipat, Rohtak and Karnal. These cities experience traffic congestion as well as high industrial emissions. Moreover, the agricultural operations in Haryana cause yearly pollution particularly in the pre-monsoon and post-monsoon seasons that burn the crop residues and increase the concentration of the particulate matter. In this study, to capture the geographic and demographic diversity of the state, we picked 10 parliamentary constituencies. In cases where real-time air quality data could not be obtained concerning the main city of a constituency, we obtained the real-time data of close cities in the same constituency so that it would be comprehensively covered. The sites were selected based on the availability of continuous monitoring data from CPCB stations. The choice of the sites variety, such as industrial, urban, and semi-rural area, assists us in comprehending the influence of various land usage and other human activities on the air quality trends. Hence, the field of study provides a representative picture of the situation in Haryana with the environmental state, which is why this field was selected as the most suitable to evaluate the impact of the effects of the COVID-19 lockdown on the air pollution levels during several years (
Figure 2 illustrates the geographical location of the study area in India and Haryana.). Agricultural residue burning is an important regional source of particulate pollution in northern India
| [3] | Jethva, H., Torres, O., Field, R. D., Lyapustin, A., Gautam, R., & Kayetha, V. (2019). Connecting crop productivity, residue fires, and air quality over northern India. Scientific Reports, 9, 16594. https://doi.org/10.1038/s41598-019-52799-x |
[3]
.
2.2. Data Collection
In this study, secondary air quality data were obtained from the Central Pollution Control Board (CPCB), Government of India, which operates a network of Continuous Ambient Air Quality Monitoring Stations (CAAQMS) across Haryana. Data were collected from ten selected parliamentary constituencies, each represented by its major urban center. In cases where monitoring data from a particular station were unavailable or incomplete, data from nearby stations within the same geographical region were used to ensure adequate spatial representation.
Among the air contaminants examined, fine particles under 2.5 micrometers came first in analysis - these are known to penetrate deep into lungs. Next, airborne solids up to 10 micrometers wide entered consideration because they affect respiratory systems too. Nitrogen-based gases also played a role, especially since traffic emissions contribute heavily to their presence. Where vehicle exhaust is common, carbon monoxide showed consistent patterns across measurement points. Ozone near ground level differed - it built gradually through chemical reactions in sunlight. Selection followed more than just risk; reliable tracking mattered equally. Monitoring stations supplied measurements every quarter hour without pause. From those frequent inputs, researchers derived mean values per day for consistency. Each site maintained this structure throughout the observation period.
Four years make up the observation window - 2019 through 2022 - with 2019 serving as the baseline before pandemic conditions emerged. During 2020, movement restrictions took effect, marking a distinct shift captured under the label of lockdown phase one, beginning on March 25 and lasting until April 14. What followed next were three additional segments grouped within that same calendar year: April 15 to May 3 formed the second stage; May 4 to May 17 became the third interval; then May 18 concluded with day thirty-one of that month as the final stretch. Afterward came two subsequent years where societal functions gradually resumed toward prior patterns, designated broadly as recovery periods. To maintain alignment when reviewing changes over time, identical dates reappeared each annual cycle regardless of external shifts occurring globally or locally.
2.3. Data Processing and Analysis
The dataset collected was then preprocessed in order to solve problems such as missing data, outlier data, and incorrect data values that included constant values due to instrument malfunction. The preprocessed dataset was then used in the calculation of mean concentrations of pollutants on a daily basis. This was achieved by aggregating the data in time to ensure that each daily average belonged to the correct lockdown period in each year.
Looking at differences in pollution levels before, during, and after lockdown - spanning 2019 through 2022 - a comparison emerged showing shifts tied to human activity. Because movement slowed sharply in 2020, changes were measured using percent difference to capture the drop’s effect on emissions.
For stronger analysis, a paired t-test checked whether changes in pollutant levels before and during lockdown differed significantly. Beyond that, correlations explored how various pollutants related to one another. Visual summaries appeared in bar charts and line graphs, revealing patterns across time and shifts between years.
The changes in the observed pollutant concentrations were interpreted against the backdrop of reduced vehicular movement, industrial activities, and construction works during the lockdown period. Changes in ozone concentrations were also looked at in relation to the role of nitrogen oxides in photochemical ozone formation.
3. Result and Discussion
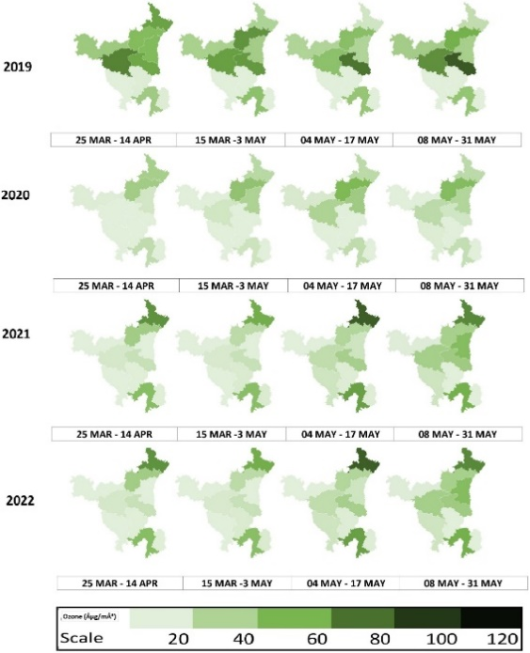
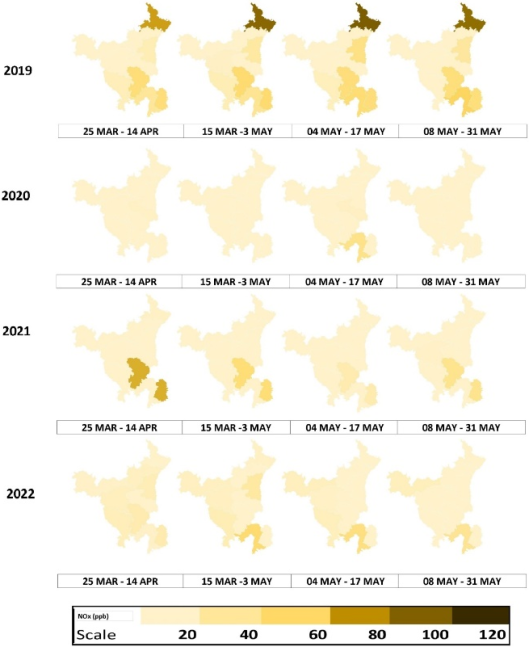
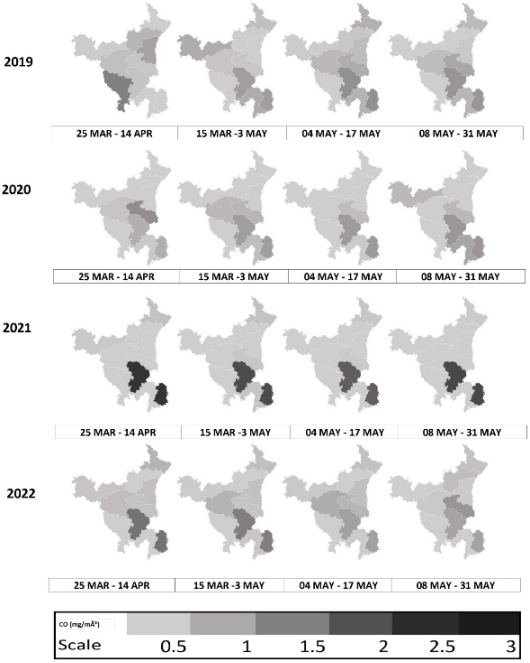
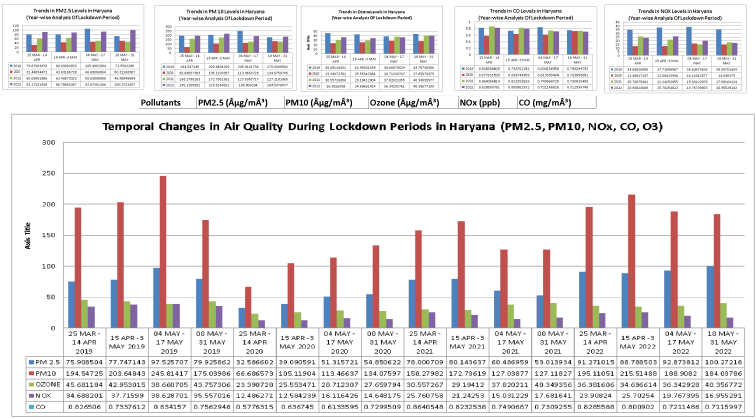
The time-series analysis of air quality across Haryana during the four lockdown phases (Lockdown 1: 25 March–14 April, Lockdown 2: 15 April–3 May, Lockdown 3: 4 May–17 May, and Lockdown 4: 18 May–31 May) for the years 2019 (pre-lockdown), 2020 (lockdown), and 2021–2022 (post-lockdown) throws light upon the temporal variation of the prime air pollutants PM2.5, PM10, NOx, CO, and O3.
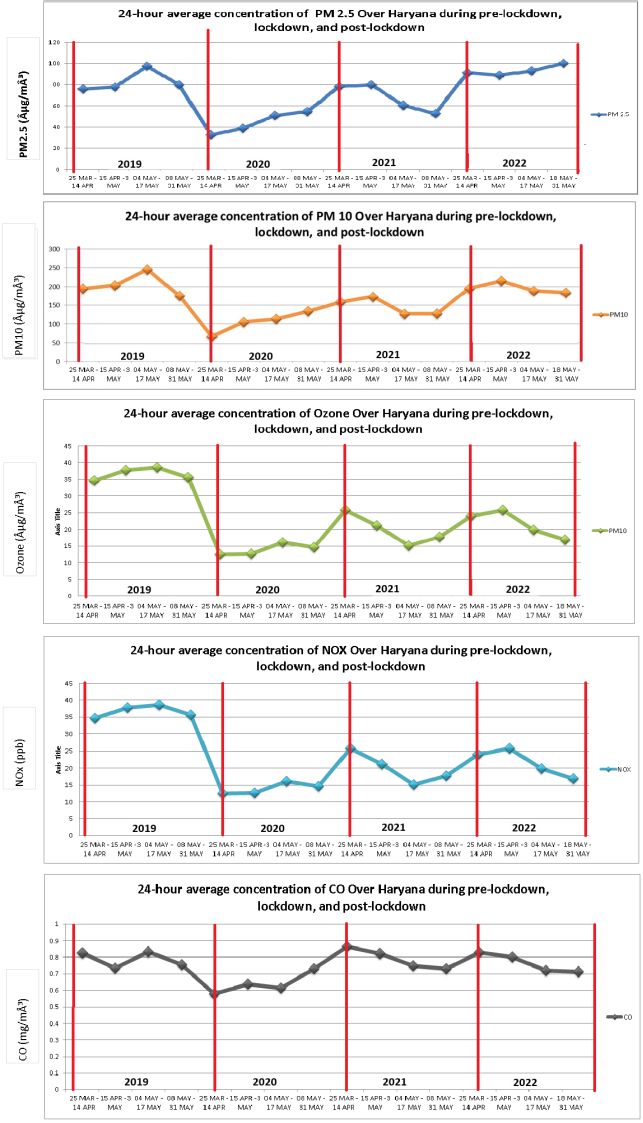
The analysis is based on the 24-hour average concentration of the considered pollutants, with the overall temporal variations shown in
Figure 8 and the comparative trends in the different lockdown phases shown in
Figure 9.
3.1. PM2.5 Trends
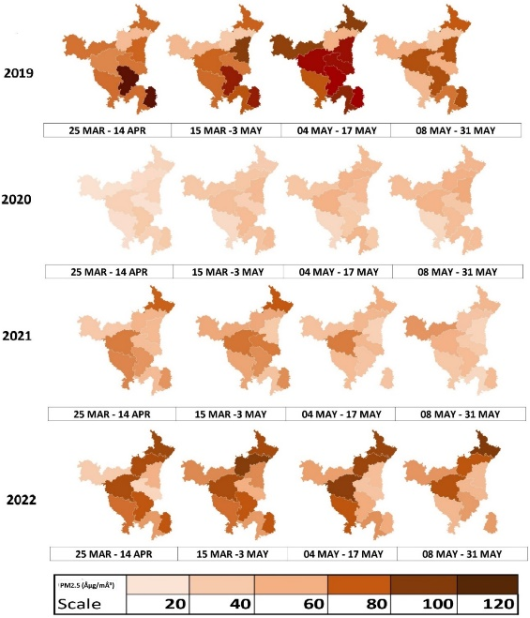
The Central Pollution Control Board (CPCB) reported a significant drop in PM2.5 concentrations during the 2020 COVID-19 lockdown. For instance, during Lockdown 1 (March 25-April 14), average PM2.5 levels in 2020 were just 32.6 µg/m3, a roughly 57% decrease from the 75.9 µg/m3 recorded in 2019. This sharp decline stemmed from reduced human activity, like less traffic and fewer industrial operations.
After the lockdown, PM2.5 levels slowly crept back up, averaging 54.9 µg/m3 in 2021 before jumping to 91.3 µg/m3 in 2022. Still, some periods did show concentrations lower than those before the lockdown. This suggests air quality improved, though only partially and for a short while.
Figure 3 illustrates the shifts in PM
2.5 concentrations across the various lockdown phases between 2019 and 2022.
Figure 3. Temporal variation of PM2.5 concentrations in Haryana during lockdown phases (2019–2022).
3.2. PM10 Trends
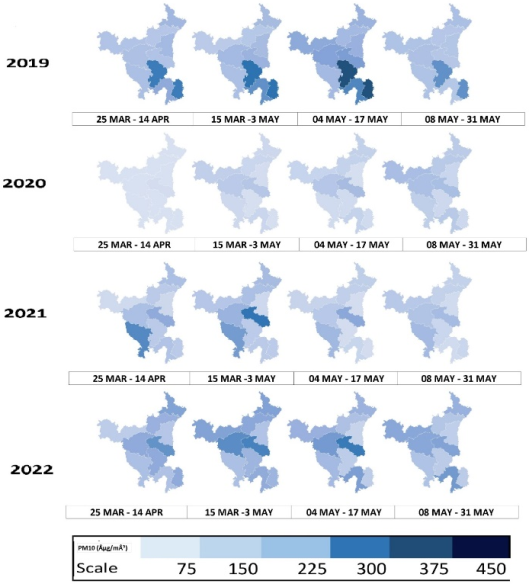
A similar decreasing trend was observed in PM10 concentrations during the lockdown period; During Lockdown 1 (25 March–14 April) of 2020, the average PM10 concentration was recorded at 66.9 µg/m3, a figure that was way below that of 194.5 µg/m3 in 2019. This is a direct consequence of the restriction on anthropogenic activities, most notably vehicular emissions, industrial activities, and construction activities.
In the following years, PM10 concentrations show a gradual increase. During the same time frame in 2022, the levels climbed to about 195.1 µg/m3, signifying a regression to pre-pandemic norms. However, the overall combination of background emission activities indicates a lockdown-based reduction in ambient parameters.
Figure 4 gives the yearly spectrum of the levels of PM
10 in various lockdown stages.
Figure 4. Temporal variation of PM10 concentrations in Haryana during lockdown phases (2019–2022).
3.3. Ozone (O3)
Ozone concentrations exhibited a relative decrease during the first lockdown period (25 March–14 April) of 2020 compared to the same timeframe in 2019. Specifically, the average ozone level declined from 45.7 µg/m3 in 2019 to 23.4 µg/m3 in 2020. This decrease could be linked to alterations in precursor emissions, notably nitrogen oxides (NOx), which are integral to photochemical ozone generation.
It should be emphasized that ozone production is controlled by intricate photochemical reactions involving interactions among NO
x, volatile organic compounds (VOCs), and solar radiation. Consequently, the reduction in ozone observed during the lockdown may indicate shifts in the atmospheric chemical dynamics rather than merely reflecting decreased emissions, a pattern also noted in prior research a pattern also noted in prior research
| [16] | Korhale, N., Anand, V., & Beig, G. (2021). Disparity in ozone trends under COVID-19 lockdown in a closely located coastal and hillocky metropolis of India. Air Quality, Atmosphere & Health, 14(4), 533–542.
https://doi.org/10.1007/s11869-020-00958-9 |
[16]
.
Figure 5 illustrates the temporal variation of ozone concentrations over multiple years.
Figure 5. Temporal variation of O3 concentrations in Haryana during lockdown phases (2019–2022).
3.4. NOx Trends
Nitrogen oxides (NOx) concentrations exhibited a substantial decrease during the lockdown period, reflecting the reduction in vehicular traffic and industrial activities. During Lockdown 1 (25 March–14 April), the average NOx concentration declined from 34.7 ppb in 2019 to 12.5 ppb in 2020, representing a reduction of over 60%.
In the subsequent years (2021 and 2022), NOx concentrations showed an increasing trend; however, the levels remained below pre-lockdown values in most phases. This indicates a partial recovery of emission sources following the easing of lockdown restrictions.
The observed reduction in NO
x concentrations is particularly significant, as NO
x plays a crucial role in atmospheric photochemistry and directly influences ground-level ozone formation
| [6] | Bedi, J. S., Dhaka, P., Vijay, D., Aulakh, R. S., & Gill, J. P. S. (2020). Assessment of air quality changes in the four metropolitan cities of India during COVID-19 pandemic lockdown. Aerosol and Air Quality Research, 20(10), 2062–2070.
https://doi.org/10.4209/aaqr.2020.05.0209 |
| [9] | Singh, V., Singh, S., Biswal, A., Kesarkar, A. P., Mor, S., & Tiwari, S. (2020). Diurnal and temporal changes in air pollution during COVID-19 strict lockdown over different regions of India. Environmental Pollution, 266, 115368.
https://doi.org/10.1016/j.envpol.2020.115368 |
| [14] | Gopikrishnan, G. S., Kuttippurath, J., Raj, S., Singh, A., & Abbhishek, K. (2022). Air Quality during the COVID–19 Lockdown and Unlock Periods in India Analyzed Using Satellite and Ground-based Measurements. Environmental Processes, 9(2), 28. https://doi.org/10.1007/s40710-022-00585-9 |
| [15] | Chauhan, A., & Singh, R. P. (2020). Decline in PM2.5 concentrations over major cities around the world associated with COVID-19. Atmospheric Environment, 225, 117401.
https://doi.org/10.1016/j.atmosenv.2020.117401 |
[6, 9, 14, 15]
.
The variation in NO
x concentrations across different lockdown phases and years is illustrated in
Figure 6.
Figure 6. Temporal variation of NOx concentrations in Haryana during lockdown phases (2019–2022).
3.5. CO Trends
Carbon monoxide (CO) concentrations showed a modest decline during the lockdown period. During Lockdown 1 (25 March–14 April), the average CO concentration decreased from 0.83 mg/m3 in 2019 to 0.58 mg/m3 in 2020. This reduction can be attributed to decreased combustion-related activities, particularly vehicular emissions and reduced industrial fuel usage.
In the post-lockdown years, CO concentrations exhibited minor fluctuations but remained relatively stable compared to other pollutants, indicating a comparatively lower sensitivity to short-term emission changes.
The variation in CO concentrations across different years and lockdown phases is presented in
Figure 7.
Figure 7. Temporal variation of CO concentrations in Haryana during lockdown phases (2019–2022).
Figure 8. Temporal Variation of 24-Hour Average Air Pollutant Concentrations (PM2.5, PM10, O3, NOx, and CO) over Haryana During Pre-Lockdown, Lockdown, and Post-Lockdown Periods (2019–2022).
Figure 9. Temporal Changes in Major Air Pollutants During COVID-19 Lockdown Periods in Haryana (PM2.5, PM10, NOx, CO, and O3).
The COVID-19 pandemic created a unique situation worldwide in which human activity was drastically reduced. The effect of this pandemic on the environment, especially air quality, was closely observed and studied. It is a well-known fact that industrial emissions and traffic emissions are the primary causes of air pollution in urban areas. In this study, we analyzed air pollution in ten cities of Haryana, India. We used air quality data from 2020 to demonstrate the improvement in air quality due to the lockdown, along with other relevant analyses.
The levels of pollution caused by PM2.5, PM10, NOx, and CO were also noted to decrease significantly during the lockdown. The concentration of O3 also decreased relatively in the first few months of the lockdown when compared to 2019. This is mainly because of the reduced activity in the industries, lesser number of vehicles on roads, and lack of ongoing construction works during the lockdown.
The emission from vehicular pollution causes an increase in NOx and CO. The substantial decrease in vehicular pollution during the period of lockdown is the cause for the reduction in NOx and CO concentration. The decrease in the production of precursors resulted in the formation of secondary pollutants like ozone due to atmospheric reactions.
Increase in the concentration of pollutants following the first lockdown periods, which was witnessed in 2021 and 2022, shows that the air quality improvement was not lasting. Resuming the pollution levels almost to the pre-pandemic levels indicates that unless the change in the structure of the cities and their urban planning is organized, as well as the transportation policy and industrial regulation, the enhancements in the quality of the air will continue to be only temporary. Therefore, The lockdown period serves as an important case study demonstrating that significant improvements in air quality are achievable through controlled reduction of anthropogenic emissions.
Major
pollution
sources
and
corresponding
mitigation
strategies
identified
in
this
study
are
summarized
in
Table 1.
Table 1. Identified Air Pollution Sources and Recommended Control Strategies.
S.No. | Focus Area | Issue | Recommended Actions |
1 | Agricultural Practices | Stubble burning causes PM2.5 & PM10 spikes | Promote residue management, subsidies, and enforce bans during peak burning season. |
2 | Urban Transport | Vehicular emissions (NOx, CO) | Encourage electric vehicles, enhance public transport, and phase out old vehicles. |
3 | Industrial Emissions | Poor regulation in clusters | Install continuous emission monitoring and enforce stricter norms. |
4 | Monitoring & Awareness | Inadequate AQI coverage | Expand stations, real-time public alerts, and education campaigns. |
Limitations: This study opens up important discussions on how the COVID-19 lockdown measures affected air pollution in Haryana. However, it is still limited in several ways that should be taken into consideration. The analysis depended on secondary data from monitoring stations of the CPCB. Besides, data gaps or instrument-related uncertainties might still have an impact on the localized estimates. Meteorological factors, e.g. temperature, wind speed, solar radiation, and boundary layer height, which have a strong influence on pollutant dispersion and the formation of secondary pollutants (especially ozone), were not even considered. In addition, the constituency-level averaging may hide variations within the city and pollution events of a very short duration. At last, by focusing only on the periods which were directly affected by the lockdown, this study does not capture the assessment of the long-term trend of changes in emissions or behavioral changes that have become normalized after the pandemic.
4. Conclusion
The present study provides a comprehensive multi-year assessment (2019–2022) of air quality variations in Haryana during pre-lockdown, lockdown, and post-lockdown periods. The findings demonstrate a significant reduction in major air pollutants, including PM2.5, PM10, NOx, and CO, during the COVID-19 lockdown in 2020, primarily due to the restriction of anthropogenic activities such as vehicular movement, industrial operations, and construction activities.
Among the pollutants, PM2.5 and NOx exhibited the most pronounced decline, indicating their strong dependence on emission sources related to transportation and industrial activities. Ozone (O3) showed variable behavior due to its complex photochemical formation mechanisms and dependence on precursor emissions.
The post-lockdown period (2021–2022) showed a gradual increase in pollutant concentrations, approaching pre-pandemic levels, which suggests that the observed improvements in air quality were temporary. This highlights the dominant role of anthropogenic emissions in determining regional air quality.
Overall, the study emphasizes that sustainable improvement in air quality requires long-term policy interventions, including stricter emission control measures, promotion of cleaner technologies, and improved urban planning. The findings provide useful insights for policymakers and environmental agencies in developing effective air pollution mitigation strategies in rapidly developing regions such as Haryana.
5. Recommendations
Based on the findings of this study, several policy measures are recommended to sustain improvements in air quality in Haryana. These include strengthening vehicular emission control through promotion of public transportation and electric vehicles, implementation of stricter industrial emission standards, expansion of continuous air quality monitoring networks, and adoption of sustainable agricultural residue management practices to reduce stubble burning. Future urban planning strategies should integrate air quality considerations and encourage green infrastructure development. Further studies should incorporate meteorological parameters and advanced statistical models to better understand pollutant dynamics and long-term air quality trends.
Abbreviations
PM2.5 | Particulate Matter with Aerodynamic Diameter Less Than 2.5 µm |
PM10 | Particulate Matter with Aerodynamic Diameter Less Than 10 µm |
NOx | Nitrogen Oxides |
CO | Carbon Monoxide |
O3 | Ground-Level Ozone |
CPCB | Central Pollution Control Board |
CAAQMS | Continuous Ambient Air Quality Monitoring Stations |
µg/m3 | Micrograms per Cubic Meter |
ppb | Parts Per Billion |
mg/m3 | Milligrams per Cubic Meter |
Author Contributions
Neha Vyas: Conceptualization, Data curation, Formal Analysis, Investigation, Methodology, Visualization, Writing – original draft
Abhishek Saxena: Methodology, Project administration, Supervision, Validation, Writing – review & editing
Ashwini Tiwari: Data curation, Resources, Software, Visualization, Writing – review & editing
Conflicts of Interest
The authors declare no conflicts of interest.
References
| [1] |
Saxena, V. (2025). Water quality, air pollution, and climate change: investigating the environmental impacts of industrialization and urbanization. Water, Air, & Soil Pollution, 236(2), 73.
https://doi.org/10.1007/s11270-024-07702-4
|
| [2] |
Aljafen, B. N., Shaikh, N., AlKhalifah, J. M., & Meo, S. A. (2025). Effect of environmental pollutants particulate matter (PM2.5, PM10), nitrogen dioxide (NO2), sulfur dioxide (SO2), carbon monoxide (CO) and ground level ozone (O3) on epilepsy. BMC Neurology, 25(1), 133.
https://doi.org/10.1186/s12883-025-04142-3
|
| [3] |
Jethva, H., Torres, O., Field, R. D., Lyapustin, A., Gautam, R., & Kayetha, V. (2019). Connecting crop productivity, residue fires, and air quality over northern India. Scientific Reports, 9, 16594.
https://doi.org/10.1038/s41598-019-52799-x
|
| [4] |
Loh, H. C., Looi, I., Ch’ng, A. S. H., Goh, K. W., Ming, L. C., & Ang, K. H. (2022). Positive global environmental impacts of the COVID-19 pandemic lockdown: a review. GeoJournal, 87(5), 4425–4437.
https://doi.org/10.1007/s10708-021-10475-6
|
| [5] |
Sharma, S., Zhang, M., Anshika, Gao, J., Zhang, H., & Kota, S. H. (2020). Effect of restricted emissions during COVID-19 on air quality in India. Science of the Total Environment, 728, 138878.
https://doi.org/10.1016/j.scitotenv.2020.138878
|
| [6] |
Bedi, J. S., Dhaka, P., Vijay, D., Aulakh, R. S., & Gill, J. P. S. (2020). Assessment of air quality changes in the four metropolitan cities of India during COVID-19 pandemic lockdown. Aerosol and Air Quality Research, 20(10), 2062–2070.
https://doi.org/10.4209/aaqr.2020.05.0209
|
| [7] |
Jain, S., & Sharma, T. (2020). Social and travel lockdown impact considering coronavirus disease (COVID-19) on air quality in megacities of India: Present benefits, future challenges and way forward. Aerosol and Air Quality Research, 20, 1222–1236.
https://doi.org/10.4209/aaqr.2020.04.0171
|
| [8] |
Mahato, S., Pal, S., & Ghosh, K. G. (2020). Effect of lockdown amid COVID-19 pandemic on air quality of the megacity Delhi, India. Science of the Total Environment, 730, 139086.
https://doi.org/10.1016/j.scitotenv.2020.139086
|
| [9] |
Singh, V., Singh, S., Biswal, A., Kesarkar, A. P., Mor, S., & Tiwari, S. (2020). Diurnal and temporal changes in air pollution during COVID-19 strict lockdown over different regions of India. Environmental Pollution, 266, 115368.
https://doi.org/10.1016/j.envpol.2020.115368
|
| [10] |
Sathe, Y., Gupta, P., Bawase, M., Lamsal, L., Patadia, F., & Thipse, S. (2021). Surface and satellite observations of air pollution in India during COVID-19 lockdown: Implication to air quality. Sustainable Cities and Society, 66, 102688.
https://doi.org/10.1016/j.scs.2020.102688
|
| [11] |
Saxena, A., & Raj, S. (2021). Impact of lockdown during COVID-19 pandemic on the air quality of North Indian cities. Urban Climate, 35, 100754.
https://doi.org/10.1016/j.uclim.2020.100754
|
| [12] |
Rathore, D. S., Nagda, C., Shaktawat, B. S., Kain, T., Chouhan, C. S., Purohit, R., Harish, Khangarot, R. K., Nagda, G., & Jhala, L. S. (2021). COVID-19 lockdown: a boon in boosting the air quality of major Indian Metropolitan Cities. Aerobiologia, 37(1), 79–103.
https://doi.org/10.1007/s10453-020-09673-5
|
| [13] |
Kumari, P., & Toshniwal, D. (2020). Impact of lockdown on air quality over major cities across the globe during COVID-19 pandemic. Urban Climate, 34, 100719.
https://doi.org/10.1016/j.uclim.2020.100719
|
| [14] |
Gopikrishnan, G. S., Kuttippurath, J., Raj, S., Singh, A., & Abbhishek, K. (2022). Air Quality during the COVID–19 Lockdown and Unlock Periods in India Analyzed Using Satellite and Ground-based Measurements. Environmental Processes, 9(2), 28.
https://doi.org/10.1007/s40710-022-00585-9
|
| [15] |
Chauhan, A., & Singh, R. P. (2020). Decline in PM2.5 concentrations over major cities around the world associated with COVID-19. Atmospheric Environment, 225, 117401.
https://doi.org/10.1016/j.atmosenv.2020.117401
|
| [16] |
Korhale, N., Anand, V., & Beig, G. (2021). Disparity in ozone trends under COVID-19 lockdown in a closely located coastal and hillocky metropolis of India. Air Quality, Atmosphere & Health, 14(4), 533–542.
https://doi.org/10.1007/s11869-020-00958-9
|
Cite This Article
-
APA Style
Vyas, N., Saxena, A., Tiwari, A. (2026). Impact of COVID-19 Lockdowns on Air Quality in Haryana:
A Multi-Year Analysis of PM2.5, PM10, NOx, CO, and Ozone. International Journal of Atmospheric and Oceanic Sciences, 10(2), 38-49. https://doi.org/10.11648/j.ijaos.20261002.11
 Copy
|
Copy
|
 Download
ACS Style
Vyas, N.; Saxena, A.; Tiwari, A. Impact of COVID-19 Lockdowns on Air Quality in Haryana:
A Multi-Year Analysis of PM2.5, PM10, NOx, CO, and Ozone. Int. J. Atmos. Oceanic Sci. 2026, 10(2), 38-49. doi: 10.11648/j.ijaos.20261002.11
Copy
|
Download
AMA Style
Vyas N, Saxena A, Tiwari A. Impact of COVID-19 Lockdowns on Air Quality in Haryana:
A Multi-Year Analysis of PM2.5, PM10, NOx, CO, and Ozone. Int J Atmos Oceanic Sci. 2026;10(2):38-49. doi: 10.11648/j.ijaos.20261002.11
Copy
|
Download
-
@article{10.11648/j.ijaos.20261002.11,
  author = {Neha Vyas and Abhishek Saxena and Ashwini Tiwari},
  title = {Impact of COVID-19 Lockdowns on Air Quality in Haryana:
A Multi-Year Analysis of PM2.5, PM10, NOx, CO, and Ozone},
  journal = {International Journal of Atmospheric and Oceanic Sciences},
  volume = {10},
  number = {2},
  pages = {38-49},
  doi = {10.11648/j.ijaos.20261002.11},
  url = {https://doi.org/10.11648/j.ijaos.20261002.11},
  eprint = {https://article.sciencepublishinggroup.com/pdf/10.11648.j.ijaos.20261002.11},
  abstract = {Background: The COVID-19 pandemic and nationwide lockdown in India during 2020, led to an unprecedented decrease in anthropogenic activities, offering a rare chance to assess the effect of anthropogenic activities on ambient air quality. Objective: To understand the impact of COVID-19 lockdown on the main air pollutants of Haryana, India and to compare the air quality condition before, during, and after the COVID-19 lockdown. Methods: Air quality parameters: PM2.5, PM10, NOx, CO and O₃ were obtained from Continuous Ambient Air Quality Monitoring Stations (CAAQMS) operated by Central Pollution Control Board (CPCB). Data of ten parliamentary constituencies were taken from across Haryana and analysed in the time period of 2019-2022. Pollutant levels in 2020 during four lockdown periods were compared to those in 2019, 2021 and 2022. Average concentrations were computed daily and temporal trends were analyzed to detect changes in pollutant concentrations. The results in this thesis showed significant reductions in PM2.5, PM10, NOₓ and CO levels during the lockdown period. During the first phase of the lockdown, a sharp drop in traffic, industry activity and construction, led to a decrease in PM2.5 concentrations of almost 50%, and in NOₓ levels of more than 60%. Similarly, there were substantial decreases of PM10 and CO from pre-lockdown periods. The behavior of the ozone concentration varied significantly as a result of some complex photochemical processes, involving the emissions of precursors and the atmospheric conditions. But concentrations increased slowly over the next few years following the pandemic (2021-2022) towards pre-pandemic concentrations. Conclusion: The study clearly shows that anthropogenic activities have a significant impact on the air quality in Haryana. The rebound in pollutant concentrations after the lockdown shows that sustainable long-term strategies for air pollution control are necessary, such as developing clean transportation systems, setting tighter limits on industrial emissions, and improving urban planning Solutions.},
 year = {2026}
}
Copy
|
Download
-
TY  - JOUR
T1  - Impact of COVID-19 Lockdowns on Air Quality in Haryana:
A Multi-Year Analysis of PM2.5, PM10, NOx, CO, and Ozone
AU  - Neha Vyas
AU  - Abhishek Saxena
AU  - Ashwini Tiwari
Y1  - 2026/09/18
PY  - 2026
N1  - https://doi.org/10.11648/j.ijaos.20261002.11
DO  - 10.11648/j.ijaos.20261002.11
T2  - International Journal of Atmospheric and Oceanic Sciences
JF  - International Journal of Atmospheric and Oceanic Sciences
JO  - International Journal of Atmospheric and Oceanic Sciences
SP  - 38
EP  - 49
PB  - Science Publishing Group
SN  - 2640-1150
UR  - https://doi.org/10.11648/j.ijaos.20261002.11
AB  - Background: The COVID-19 pandemic and nationwide lockdown in India during 2020, led to an unprecedented decrease in anthropogenic activities, offering a rare chance to assess the effect of anthropogenic activities on ambient air quality. Objective: To understand the impact of COVID-19 lockdown on the main air pollutants of Haryana, India and to compare the air quality condition before, during, and after the COVID-19 lockdown. Methods: Air quality parameters: PM2.5, PM10, NOx, CO and O₃ were obtained from Continuous Ambient Air Quality Monitoring Stations (CAAQMS) operated by Central Pollution Control Board (CPCB). Data of ten parliamentary constituencies were taken from across Haryana and analysed in the time period of 2019-2022. Pollutant levels in 2020 during four lockdown periods were compared to those in 2019, 2021 and 2022. Average concentrations were computed daily and temporal trends were analyzed to detect changes in pollutant concentrations. The results in this thesis showed significant reductions in PM2.5, PM10, NOₓ and CO levels during the lockdown period. During the first phase of the lockdown, a sharp drop in traffic, industry activity and construction, led to a decrease in PM2.5 concentrations of almost 50%, and in NOₓ levels of more than 60%. Similarly, there were substantial decreases of PM10 and CO from pre-lockdown periods. The behavior of the ozone concentration varied significantly as a result of some complex photochemical processes, involving the emissions of precursors and the atmospheric conditions. But concentrations increased slowly over the next few years following the pandemic (2021-2022) towards pre-pandemic concentrations. Conclusion: The study clearly shows that anthropogenic activities have a significant impact on the air quality in Haryana. The rebound in pollutant concentrations after the lockdown shows that sustainable long-term strategies for air pollution control are necessary, such as developing clean transportation systems, setting tighter limits on industrial emissions, and improving urban planning Solutions.
VL  - 10
IS  - 2
ER  -
Copy
|
Download





 Share This Article
 Twitter
 Linked In
 Facebook