Research Article | | Peer-Reviewed

The Outstanding Excellences of Interactive Energy Density Topology Change Method

Received: 3 March 2024    Accepted: 18 March 2024    Published: 2 April 2024
Views:       Downloads:
Abstract

It has not been solved that the fruits, vegetables, strawberries, cells, blood and a bottle of liquor are damaged, broken during transportation. It is the greatest factor in this situation that there is a danger vibration frequency band where these are easy to scratch and are prone to death. If there are eigen frequencies within this danger frequency band, it needs that those eigen frequencies within this danger frequency band are moved out of the band. In the former paper, it was shown difficult to apply the existing topology optimization methods using homogenization method or density method to control plural eigen frequencies for solving this problem. Therefore in the former paper, it was proposed the so called “Interactive Energy Density Topology (IEDT) change method” that is a new high precision and high efficiency method for controlling plural eigen frequencies simultaneously referring to the kinetic and the strain energy density distributions. Here it is discussed more about the IEDT change method and show that it is sometimes difficult for the traditional methods to get solutions because especially in the dynamic problem, eigen frequencies may go up or down depending on its size even if reinforcement or hall for change topology is applied at the same location. But with the proposed IEDT change method, always it can be realized because the proposed method has wider solution spaces than the traditional one. Lastly, it is shown that this IEDT method is also very effective to reduce the integral value of response curve by frequency.

Published in International Journal of Mechanical Engineering and Applications (Volume 12, Issue 2)
DOI 10.11648/j.ijmea.20241202.11
Page(s) 37-49
Creative Commons

This is an Open Access article, distributed under the terms of the Creative Commons Attribution 4.0 International License (http://creativecommons.org/licenses/by/4.0/), which permits unrestricted use, distribution and reproduction in any medium or format, provided the original work is properly cited.

Copyright

Copyright © The Author(s), 2024. Published by Science Publishing Group

Keywords

IEDT Change Method, Frequency Response, Topology Optimization, Density Method, Index of Generalized Eigen Frequency, Kinetic Energy Density, Strain Energy Density, Danger Frequency Band

1. Introduction
Fruits and vegetables, blood, induced pluripotent stem (iPS) cells, bottles of liquor and wine have frequency bands that are susceptible to damage. And so the box system should be designed such that it has not the eigen frequencies within these danger frequency bands.
To expel the eigen frequencies from the danger frequency band, for example, it is redesigned that some eigen frequencies to be higher and some eigen frequencies to be lower.
As far as this problem, in the former paper , it has proven difficult to achieve using traditional topology optimization methods which consist of the using homogenization , density method .
Therefore, it was developed a new method of controlling the eigen frequencies by returning to the origin of the vibration theory, in which the eigen frequency is determined by the equivalent stiffness and the equivalent mass. Assuming that the shipping box is transported by placing it on a soft object, the desired results were obtained by considering the flat plate as a shipping box under free-free condition . Here with the same model, but this time under different simple support, it is considered the significance and new applications of this method. In other words, in traditional topology optimization analysis, the optimized solution can be obtained with the design variables distributed in that state while maintaining the current topology. Based on the above results, holes are created at locations below the threshold. On the other hand, with the proposed method, the solution can be found interactively while change the topology by predicting the direction of change of each eigen frequency with referring to strain and kinematic energy density distributions. Although it is sometimes difficult for the traditional methods to get solutions because especially in the dynamic problem, eigen frequencies may go up or down depending on its size even if reinforcement is applied at the same location. But with the proposed method, always it can be realized because the proposed method has wider solution spaces than the traditional one and with the proposed method, the solution can be found faster and more reliably. Moreover, even though it is not convergent by the traditional method, it cannot be clear whether the set objective function is appropriate or not. However, it becomes clear by referring to strain and kinematic energy density distributions of the eigen modes under consideration that are used in the new proposed method. And it is shown that the task will be reset to a more reasonable one based on this information. Lastly, it is shown that this IEDT change method is not only effective to reduce the peak response value but also much more effective in reducing integral value of response value within dangerous band than the traditional optimization analysis for minimization of the integral value.
2. Topology Optimization Method Using Traditional Density Method and New Proposed Method
The goal of this research is the design of transport boxes that safely carry strawberries, cells, and blood. But here the object is to certify the proposed method and so the model is a rectangular flat plate with the size of 420 mm × 300 mm, thickness of 1 mm as indicated in Figure 1. The material of the plate is cardboard, which has a density of 256.9 kg/m3, Young’s modulus of 0.664 GPa and Poisson’s ratio of 0.34. As indicated in the same figure, the flat plate that divided into 120 (30 mm long and 35 mm wide per piece). By modal analysis under simple support conditions all around, 1st to 4th orders are 12.99 Hz, 26.13 Hz, 38.71 Hz, 47.96 Hz. It is dealt with the problem where the box system has no eigen frequencies between 25.0 Hz and 40.0 Hz which is considered to be a danger frequency band.

2.1. Application of Density Topology Optimization Method

Here, by using the density topology optimization method, because the 2nd and 3rd eigen frequencies are in this danger frequency band and the 1st and 4th eigen frequencies are far from the danger frequency band, it is started by not considering the 1st and 4th orders. It is set the 2nd and the 3rd target eigen frequencies to 24.0 Hz and 41.0 Hz respectively. The objective function of the optimization is the generalized eigenvalue index indicated in Eq. (1),
fx=f0*+(i=1mWifi-f0in/i=1mWi)1/n (1)
fi (i = 1, 2) are the target values 24.0 Hz and 41.0 Hz of the 2nd and 3rd eigen frequencies, f0*=0 Hz, n = 2, and m is the number of eigen frequencies to consider, here m = 2. Wi(i=1~2) are weights. The density topology optimization is performed as follows. (1) The design variables are the plate thickness of each element except the plate thicknesses of the elements in surrounding part so that the outer shape does not change by optimization calculation. (2) As indicated in Figure 1, the elements are divided into right and left, up and down symmetry, and is also set so that symmetry is maintained.
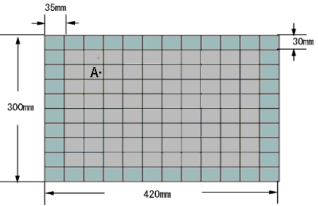
Figure 1. FEM model of test piece: 120 elements. Eigen frequencies from first to forth under simple support condition: 12.999Hz, 26.155Hz, 38.777Hz, 48.044Hz.
Above results, the number of rectangular elements is 120 and its of design variables is 20. The thickness of each element shall be 0 mm in the lower limit and 1.0 mm in the upper limit. (3) The convergent condition is the value of Eq. (1) is 0.1 or less. Or, it is set the maximum number of iterations to 8000. (4) Modal analysis using the finite element method and optimization by linear approximation method are both with COMSOL Multiphysics 5.5 . (5) weight reduction is given as a constraint function. Here, the total weight of the cardboard in the shape of Figure 1 is 32.4 g, and the weight corresponding to 40 elements of the surrounding part is 10.8 g so that the lower limit is 11 g, and the upper limit is 90% of current weight, 29.16 g.
The above optimization has been performed. With W= [1.0,1.0], the repeat number 400 or later, the 2nd and 3rd eigen frequencies converge to 24.76 Hz and 38.39 Hz respectively as shown in Figure 2 left, that is, the 3rd one does not converge to the target frequency. If it is increased the third-order weight and recalculated with W= [1.0,1000.0], the repeat number 150, the 2nd and 3rd eigen frequencies converge to 26.16 Hz and 38.79 Hz respectively. That is, the third order is still almost unchanged from the initial value and on the other hand, the 2nd order gets worth by making the weight relatively small. Because the topology optimization model is usually divided into finer elements, it is calculated with 1280 elements where after repeating 180 times, the target value was not reached and converged. The calculation time was 8 hours although the calculation time required for convergence with the 80 elements model in Figure 1 was 40 minutes. Here, why doesn't it converge to the target value. It will be tried to clarify this in the next section although reasons for failure to converge have never been mentioned.
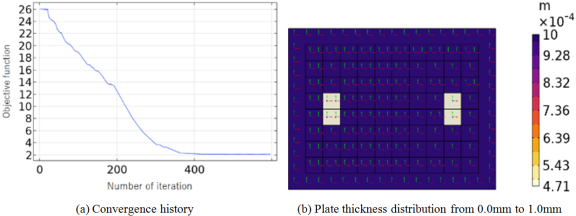
Figure 2. Results by conventional topology optimization using thickness distribution: Left: Objective function history; It converges around 400 iterations. Right: Final plate thickness distribution. The 2nd eigen frequency is 24.76 Hz and reaches the target. But the 3rd one is 38.39 Hz and does not reach the target.

2.2. The Proposed Method “Interactive Energy Distribution Topology (IEDT) Change Method”

Now it is briefly described the proposed method to the extent that it can be discussed here.
The newly proposed IEDT change method using energy density is as follows. First, the energy density distribution of each eigen frequency mode to be moved is investigated, and the position of the spring part with large strain energy density distribution and the mass part having large kinetic energy density are grasped for each eigenmode. If you want to loWEr the eigen frequency, holes are provided on the spring part or reinforcements are provided on the mass part. If you want to increase it, holes are provided on the mass part or reinforcements are provided on the spring part. The eigen frequency is controlled by providing holes or reinforcements, but from the viewpoints of weight reduction and work efficiency, the work of providing holes is first made.
Each eigen angular frequency is given by Eq. (2).
(2)
Where ω n, k n, and m n of Eq. (2), are nth order eigen angular frequency, equivalent stiffness, and equivalent mass. If the equivalent stiffness becomes smaller by providing holes on the spring part, or if the equivalent mass is increased by providing reinforcements on the mass part, the eigen angular frequency decreases. Conversely, when it is necessary to increase the eigen angular frequency, holes are provided on the mass part and/or reinforcements are provided on the spring part. This is the basic idea of this newly proposed method.

2.3. Attempt to Elucidate the Cause for Not Getting the Desired Results in the Previous Section

It is unclear whether the reason why convergence was not achieved was due to the correct problem setting in the first place or due to the lack of validity of settings such as weights or due to the lack of detail in model elements. Here, it is considered whether it is possible to determine whether the assignment settings are correct or not from energy density distributions that are the key information for the proposed IEDT change method. It is shown in Figure 3 that eigen frequencies of 1st to 4th, each strain energy Ws and each kinetic energy Wk. under conditions of simple support all around. The first line is the order and 2(1,2) means that the whole second mode, primary in short direction, secondary in longitudinal direction. The 2nd line is eigen frequencies, the 3rd line is each mode shape, the 4th line is Ws and the 5th line is Wk. Because the challenge here is first to change the topology by simply creating holes without allowing reinforcement, it is to create holes on the mass part of the 3rd eigen mode.
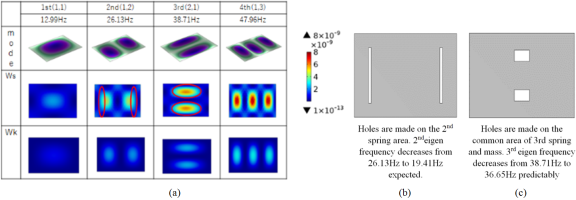
Figure 3. (a): 1st row from the top; 1st- 4th modes of the plate in Figure 2 under simple support condition. 2nd row from the top; 1st- 4th strain energy distributions. 3rd row from the top; 1st- 4th kinetic energy distributions. (b) Holes are made on the 2nd spring area. 2nd eigen frequency decreases from 26.13 Hz to 19.41 Hz as expected. (c) Holes are made on the common area of 3rd spring and mass. 3rd eigen frequency decreases from 38.71 Hz to 36.65 Hz contrary to expectations, predictably.
Although places with large numbers in Ws and Wk are common, the numbers in Ws are superior to the ones in Wk and so this common location is supposed to be spring locations. Therefore, the 3rd eigen frequency decreases after setting hole on that common location. For example, if the hole is set as shown in Figure 3(c), the 3rd eigen frequency decreases to 36.65 Hz as predicted. This means that increasing the 3rd order is difficult to begin with and so this means that the problem setting lacked validity. On the other hand, there are two symmetrical locations where the numbers in Ws, Wk are both large on the 2nd eigen mode. Because the numbers are almost same, it is predicted that the 2nd eigen frequency remains almost unchanged even if a hole is set on the common location. Here, as far as the 2nd eigen mode, there are locations where only Ws or Wk are remarkable.
The task of lowering the 2nd eigen frequency may be achieved if it is set holes on the location where only the number in Ws is remarkable. In fact, it is confirmed that the 2nd eigen frequency goal can be achieved even with conventional methods. It turned out that the problem in the previous section was an impossible task in the first place by confirming the energy density distributions that are used in IEDT change method. Also, as mentioned above, although locations with large numbers in Ws and Wk are common, the numbers in Ws are superior to the ones in Wk and so this common location is supposed to be spring locations.
And so if it is reinforced on this common location, there is a possibility that the 3rd eigen frequency will increase and the problem will be solved. Therefore, it will be considered the case where reinforcement is allowed in the next section.

2.4. Application of Density Topology Optimization Method for Convergence Tasks

With the conventional topology optimization method for the problem in section 2.1, the target eigen frequency was not reached. At that time, design variable plate thickness was from 0.0mm to 1.0mm. It is possible to reach the goal by increasing the plate thickness to 1.0 mm or more, because it is conceivable that the goal can be achieved through countermeasures by reinforcement are also allowed. It was tried to control the 2nd and 3rd eigen frequencies by setting the 2nd and the 3rd target eigen frequencies to be 24.0 Hz and 41.0 Hz respectively. The other conditions for the optimization are same as the ones in section 2.1. The restraint condition is also the same as the ones in section 2.1, less than 90% of the weight. As a result, after the number of iterations is 390, each eigen frequency from the 1st to the 4th converges to 12.393Hz, 23.965 Hz, 40.764Hz, 47.347 Hz and reaches the goal. The weight changes from 32.36g to 29.18g that also reaches the restraint condition. The last shape is shown in the left of Figure 4 and the history until convergence is shown in the center of Figure 4 The white part is the thinnest 0.1mm and the dark blue part is the maximum thickness, 3.0 mm. The thickness of each part varies from 0.1mm to 3.0mm in a complicated manner and so it is very expensive to get its manufactured products by additive 3D printer. As is often done, if you make holes at locations of 0.3mm or less and add 3.0mm reinforcement at locations of 2.4 mm or more, it becomes the shape as shown in Figure 4 right. With this shape under simple support all around, the eigen frequencies from the 1st to the 4th are 11.937 Hz, 23.551Hz, 35.577Hz, 44.413Hz and so even though it is possible to move all eigen frequencies out of the danger frequency range, some eigen frequencies move to the danger frequency range again after change the topology with holes and/or reinforcements. As a result, it can be said that with this conventional method, it is quite difficult to carry out the actual design.
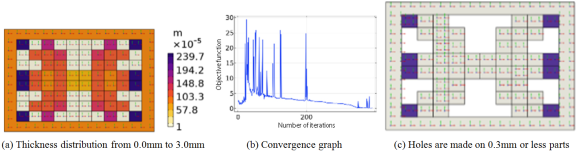
Figure 4. Results obtained through reinforcement: Left; thickness distribution from 0.0mm to 3.0mm when eigen frequencies (1st, 2nd, 3rd, 4th) converge to (12.393 Hz, 23.965 Hz, 40.764 Hz, 47.347 Hz). It reaches goal. Center; objective function history, the horizontal axis is the number of iteration, the vertical axis is the generalized eigen frequencies index. Right; holes are made on 0.3 mm or less parts and reinforcements are provided on 2.4 mm or more parts from plate thickness 1mm to 3mm. As a result, eigen frequencies (1st, 2nd, 3rd, 4th) become (11.937Hz, 23.551Hz, 35.577Hz, 44.413Hz). It leaves the goal again.
3. Application of IEDT Change Method and Consideration
In the previous chapter, it was attempted to achieve the goal using the traditional topology optimization method. In section 2.1, it was performed optimization analysis for the topology change design with setting holes by selecting design variables to the element thickness from 0.1mm to 1.0mm. Although the solution could not be obtained, it was unclear why it could not be obtained. The cause was not only clarified in section 2.2 by referring to the elastic and kinetic energy density distributions of eigen modes in question that are the key items of the proposed method but also generated a problem that converged from a problem that did not converge. It was also shown that it is difficult to carry this traditional method out to actual design even though the problem converged.
So in section 3.1, it is applied the new method so called IEDT change method to the problem that can be applied with the traditional method in section 2.3 and show that the proposed method is much more efficient than the traditional method. Because with the traditional topology optimization, the study proceeds with the topology of the current structure as it is and after the optimization analysis, topology is changed. Therefore, the existence range of the solution with the traditional method is supposed to be limited. Here IEDT change method is further considered. A representative feature of vibration phenomena is that even if the same location is reinforced, whether each eigen frequency goes up or down depends on the level f reinforcement. Although the target eigen frequency does not change even if it is reinforced or installed holes on the place where both numerical values in Ws and Wk are low, the order of the numerical values in Ws and Wk may change if it is reinforced or made holes on the place where both numerical values in Ws and Wk are large. With the traditional topology optimization analysis, the optimal value is found in the current phase state so that it is fallen into a local optimum which is influenced strongly by the status of initial Ws and Wk. so that with the traditional method, it is difficult to follow the feature of vibration phenomena. And so, it is very difficult to solve the dynamic problem with the traditional method. From such a thing, it is a good chance that the problem in section 2.1 that cannot be solved with the traditional method can be solved with the IEDT change method, that is shown in section 3.2. Moreover, achieving the task with reinforcement alone is shown in section 3.3 with the IEDT change method by taking into consideration that the order of the numbers on Ws and Wk will change.

3.1. Control of Eigen Frequencies by IEDT Change Method

Here the IEDT change method is applied to the same item as shown in section 2.3 which includes reinforcement. As shown in step 1 of Figure 5, holes 180mm long and 10mm wide are installed on the spring part of 2nd eigen mode to decrease the 2nd eigen frequency. The red circle parts are places with large numbers on Ws where the numbers on Wk are not large.
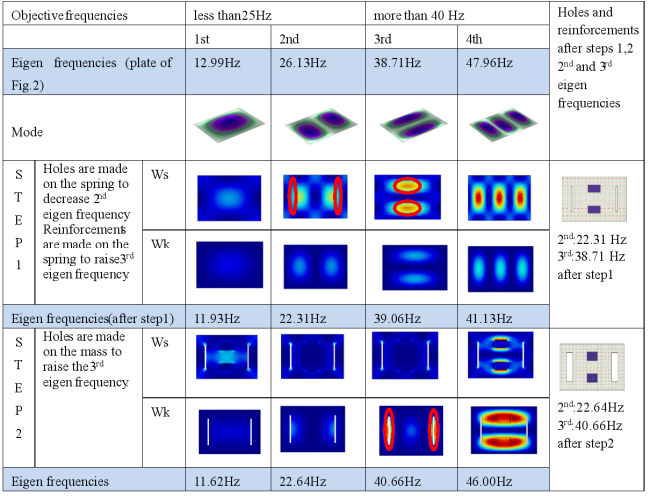
Figure 5. Results by interactive energy density topology change method: in step 1, holes are made on the red circle parts of 2nd eigen mode strain energy density distribution to decrease the 2nd eigen frequency. Reinforcements are provided on the red circle parts of 3rd eigen mode strain energy density distribution to raise the 3rd eigen frequency. As the result, eigen frequencies (1st, 2nd, 3rd, 4th) = (11.93 Hz, 22.31 Hz, 39.06 Hz, 41.13 Hz). 2nd eigen frequency reaches the target but 3rd one does not yet reach the goal. In step 2, holes are made. As the result, eigen frequencies (1st, 2nd, 3rd, 4th) = (11.62 Hz, 22.64 Hz, 40.66 Hz, 46.00 Hz). It reaches the goal.
As far as the 3rd eigen frequency, it is given up for the reasons mentioned above to raise the 3rd eigen frequency by setting holes on the mass part. It is aimed to increase the 3rd one by raising the thickness of the rectangular area 60mm long and 80mm wide circled in red to be doubled to 2.0mm in step 1 of Figure 5. After the modifications corresponding to the above 2nd and 3rd orders, (1st, 2nd, 3rd, 4th) eigen frequencies become (11.30 Hz, 22.31Hz, 39.06 Hz, 41.13 Hz), that is, the 2nd reaches the goal but the 3rd does not reach to 40Hz although it is higher than the initial one. If it is displayed the energy densities of the 3rd eigen mode again in this state, it becomes step 2 in Figure 5. There are no noticeable spring parts with high strain energy density distribution. For it, there are noticeable mass parts with high kinetic energy distribution on both left and right ends of the panel. These mass parts include the holes considered for the 2nd eigenmode in step 1. Therefore, if new holes are made 180mm long and 10mm wide at this location, (1st, 2nd, 3rd, 4th) eigen frequencies become (11.62 Hz, 22.64 Hz, 40.66 Hz, 46.00 Hz), that is, the goal was achieved with just two interactive operations. Here IEDT change method will be compared the calculation time with the traditional topology optimization method used in section 2.3. In both cases, the most time-consuming routine is the eigenvalue analysis. Eigenvalue analysis for the solution was performed 390 times in section 2.3 and on the other hand, eigenvalue analysis was performed only 2 times with this IEDT change method. Because the traditional method uses optimization routines, other calculation times are also longer with the traditional method. From the above, the calculation time with IEDT change method is significantly reduced to approximately 1/195. In addition to this traditional method, the following two routines are added. 1st is to create holes below a certain threshold and the other is to reinforce areas above a certain threshold. In the proposed method, operations to determine where to make holes and where to reinforce from energy density distributions are included. But the CPU time for these operations is shorter than one eigen analysis. And so with this model, the proposed method can obtain a solution with a significant time reduction of 1/150 or more.
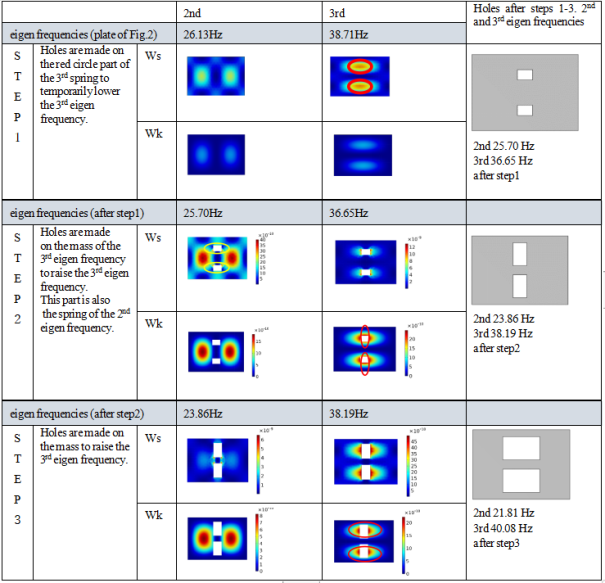
Figure 6. The achieved flow by interactive density topology change method to move all the eigen frequencies out of the danger frequency range with only 3 iterations. This has been achieved with just a set of holes which was not achieved by the traditional topology optimization method in 2·1.

3.2. Further Consideration 1 of IEDT Change Method - Consideration Based only on Hole Installation

In this section, it is started from the flat plate state shown in Figure 1. The aim is to move all eigen frequencies out of the danger frequency band from 25Hz to 40Hz by simply installing holes. This was tried in section 2.1 with the traditional method but failed. In step 1 of Figure 6, it is shown the energy density distributions of the 2nd and 3rd eigenmodes of the flat plate in Figure 1. Again, Ws is strain energy density distribution and Wk indicates kinetic density distribution. Although where the numbers on Ws are large, the numbers on Wk are often also large, if you make holes where the numbers on Ws are larger than the numbers on Wk., the eigen frequency will decrease. Although this goes against the purpose of increasing the 3rd eigen frequency, let’s make holes 40 mm length and 60 mm width in the part circled in red on Ws. Its shape is shown in the right end column. As a result, the 2nd eigen frequency becomes 25.70Hz and the 3rd one decreases to 36.65Hz as predicted. From energy density distributions shown in Step 2 of Figure 6 of the 3rd eigen mode after step 1, it can be seen a large kinetic energy density in the area circled in red. Here, the numbers of the strain energy density are also large but the numbers of kinetic density are larger than the ones of strain energy density. Therefore, by creating a hole here, it can be expected that the eigen frequency will increase. The hole is installed 100mm long and 60mm width, that is, the hole size is increased only in the length direction without change the width as shown in step 2 right end of Figure 6. As the result, the 3rd eigen frequency increases to 38.190 Hz as expected but it does not reach to 40Hz. This hole is also the spring part of the 2nd eigen mode and so the 2nd eigen frequency decreases to 23.86 Hz with this hole. It is shown in step 3 of Figure 6 the energy density distributions in this state. There is a remarkable mass part on the red circle of the 3rd kinetic energy density distribution where the numbers on Ws are also large. But the numbers on Wk are larger than the ones on Ws and so by leaving the length direction of the hole as 100mm and increasing the width direction of the hole to 160 mm, the 3rd eigen frequency becomes to 40.081 Hz that reaches the goal. The final shape is shown in step 3 right end of Figure 6. As the width of the hole for the 3rd eigen frequency increases from step 1 to step 3, this hole part includes the spring part of the 2nd eigen frequency which means that increasing the hole size for the 3rd eigen frequency comes down to create a hole on the spring part of the 2nd eigen frequency. This means the 2nd eigen frequency also decreases as desired. As above, (1st, 2nd, 3rd, 4th) eigen frequencies become (12.49 Hz, 21.81 Hz, 40.08 Hz, 42.32 Hz), that is, it can be controlled so that there are no eigen frequencies within the danger frequency band with the proposed method by only setting halls. While change topology, the proposed method searches a solution which cannot be handled using traditional method because the solution can only be handled if the numbers on Ws and Wk are reversed depending on the size of the hole and reinforcement which are specific to vibration problems. As above, it could be confirmed that this proposed method can get a solution which cannot be solved with the traditional methods.

3.3. Further Consideration 2 of IEDT Change Method- Consideration Based only on Reinforcement

In this section, it is considered whether the desired result can be obtained with reinforcement alone. Ws and Wk at start point are shown in step 1 of Figure 7. First, the red circle part on Ws of the 3rd eigen mode is a spring part and so the 3rd eigen frequency is expected to increase above the current eigen frequency 38.77HHz by reinforcing this part. It is reinforced the plate thickness from 1.0mm to 2.0mm on red circle part. On this part, both of the numbers on Ws and Wk of the 2nd eigen mode are low and so this reinforcement does not affect to 2nd eigen frequency value. If the numbers on Ws and Wk of 2nd eigen mode in step 1 are compared, the numbers on Ws are larger than the ones on Wk in the red circle part on Wk. Therefore, this part is considered to be spring part. So, if reinforcement is performed on this part, the 2nd eigen frequency is supposed to raise. If it is performed the plate thickness from 1.0mm to 2.0mm in the red circle part of the 2nd eigen mode in addition to 2.0mm reinforcement in the red circle part of the 3rd eigen mode, its shape looks like the one on the right and both of the 2nd and the 3rd eigen frequencies increase to 28.52 Hz and to 44.00 Hz respectively as predicted, that is, the 3rd eigen frequency reaches to the goal. Therefore, from here, leaving the 3rd reinforcement as is, it is tried to find the design specification such as the 2nd eigen frequency moves out of the danger frequency range. Confirming Ws and Wk of the 2nd eigen mode in step 2 of Figure 7 which are generated after step 1, the numbers on Wk are superior to the ones on Ws, that means this red circle part changes to mass part of the 2nd eigen mode. So, when reinforcement is done from plate thickness 2mm to 3mm, the 2nd eigen frequency decreases as predicted to 27.33Hz. Because both of the numbers on Wk and Ws of the 3rd eigen mode are small in this red circle on Wk of the 2nd eigen mode, the 3rd eigen frequency remains almost unchanged as predicted at 44.12Hz with the reinforcement in the red circle of the 2nd eigen mode. By confirming Ws and Wk of the 2nd eigen mode in step 3 of Figure 7 that are the energy density distributions after modifications in step 2, the numbers on Wk are still greater than the ones on Ws. Therefore, because this red circle part is still mass part, the 2nd eigen frequency will decrease if the plate thickness is 3mm or more after reinforcement in this part. The 2nd and 3rd eigen frequencies are 26.03Hz and 43.91Hz if the plate thickness is 4.0mm after reinforcement and they are 24.84Hz and 43.55Hz if the plate thickness is 5.0mm after reinforcement in this part. As predicted, the 2nd eigen frequency decreases and the 3rd one remains almost unchanged. This red circle part was a spring part of the 2nd eigen mode but this part changed to a mass part after the reinforcement in step 1. After that the mass part continued with more reinforcement and so as reinforcement in this part increases further, the 2nd eigen frequency decreases. Although the figures of Ws and Wk are omitted here after 5.0mm reinforcement in this part in step 3, the 2nd eigen frequency will decrease more if the plate thickness is greater than 5.0mm after reinforcement, no more attempts will be made here. The 1st and 4th eigen frequencies are 13.28Hz and 49.53Hz, that is, all eigen frequencies are out of the danger frequency band. That’s all, the final shape is shown in step 3 right end with right and left reinforcements 90mm long, 40mm width and thickness 5mm for the 2nd eigen frequency in addition to the reinforcement with upper and loWEr with long 60mm, width 80mm and thickness 2.0mm for the 3rd eigen frequency referring to Ws and Wk interactively.
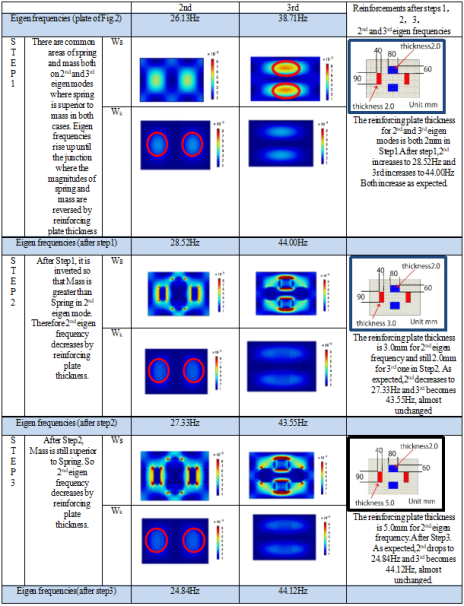
Figure 7. The achieved flow by interactive density topology change method to move all the eigen frequencies out of the danger frequency range with only 4 iterations. This has been achieved with just a set of reinforcements.
4. Minimization of Frequency Response Integral Value in Danger Frequency Band
It was clarified that this proposed IEDT change method can handle all three shapes such as with only holes, with only reinforcements and with both of holes and reinforcements for changing topology. By the way, purpose of setting danger frequency band is to eliminate significant local maxima and to reduce the integral value of the response value by frequency in this band for which only optimization analysis has been used . In this chapter, It will be considered how much IEDT change method can contribute to these two issues.

4.1. Assignment Settings

The flat plate in Figure 1 is considered to be a shipping box. It is supposed it is simply supported on the floor of a car. Frequency response diagram of point A in Figure 1 is shown in Figure 8 under simple support all around applied by the same load value in the z direction to all nodes other than the boundary points. Here, damping value is 0.01. Looking at the Figure 8, when the frequency band of danger is supposed to be from 25 Hz to 40 Hz, even if the proposed method is used, the effect is unknown because there are no large peaks from 25 Hz to 40Hz.
There is a large peak in the 1st eigen frequency and so it is confirmed the effectiveness of the proposed IEDT change method by considering that from 5Hz to 15Hz as the frequency band of danger. For this purpose, it is tried to move the 1st eigen frequency to 15Hz or higher.
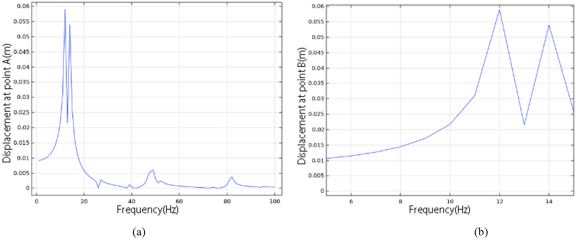
Figure 8. Displacement-frequency curve of point A on the plate in Figure 1.; (a): frequency range(0Hz-100Hz), (b): frequency range (5Hz-15Hz).
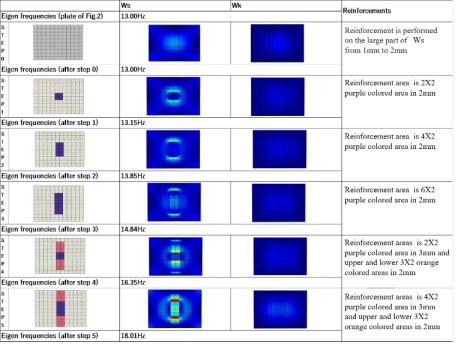
Figure 9. Reinforcement specifications based on Ws and Wk at each step and the 1st eigen frequency after reinforcement.

4.2. Consideration Regarding Response Integral Value Reduction Effect with IEDT Change Method

So first, it is tried to move the 1st eigen frequency to 15Hz or higher by using IEDT change method. The desired result is obtained after 4 interactions as shown in Figure 9. Furthermore, after one repetition, the 1st eigen frequency increases to 18.0Hz. It is shown in Table 1 the integral value from 5Hz to 15Hz at each step. Because the 1st eigen frequency is lower than 15Hz after step 3, the integral values from step 1 to step 3 are all larger than the current integral value. But after step 4, the 1st eigen frequency becomes higher than 15Hz as shown in Figure 10 and thanks to that, the integral value after step 4 is much smaller than the current value and the minimum optimal value of its integral value. Furthermore, after step 5, the 1st eigen frequency becomes 18 Hz. As a result, the integral value after step 5 drops dramatically as shown in Table 1. As described above, this IEDT change method has been shown to be extremely effective in both lowering the maximum value within the danger frequency band and lowering the integral value. In addition, analysis using the finite element method and optimization analysis using the linear approximation method are due to COMSOL Multiphysics 5.5 . The optimization analysis is performed such as (1) objective function is integral value W(i), i is the number of repetitions. (2) design variables are each thickness t (1mmt10mm) of 80 elements that do not touch the border. (3) stop condition is satisfaction of convergence condition regarding integral value such as W(n)-W(n-1)/W(n) 0.01 or the number of repetitions is 1,000. Here, W(n), W(n-1) are each the nth, (n-1)th integral value. As shown the convergence history in Figure 11, it is converged in 244 times. The optimal value in Table 1 is the convergence value after 244 repetitions.
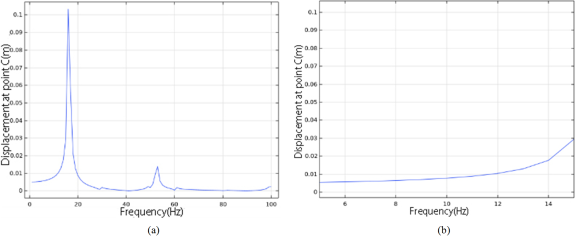
Figure 10. Displacement-frequency curve of point A on the plate in Figure 1 after step 4.; (a): frequency range (0Hz-100Hz), (b): frequency range (5Hz-15Hz).
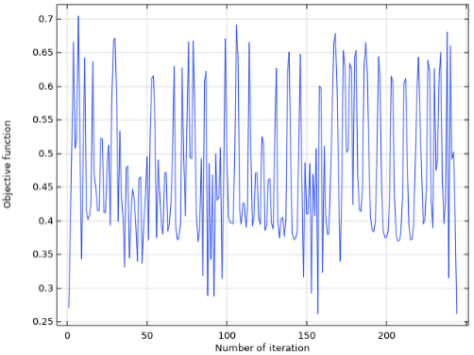
Figure 11. Convergence history.
Table 1. Comparison of integral values obtained with IEDT change method and with optimization analysis for minimum objective value.

Integral value

1st eigen frequency

Weight

Plate in Figure 1

0.27964

13.0Hz

0.032369kg

After optimization

0.26322

13.0Hz

0.034085kg

Step1

0.53155

13.0Hz

0.033448kg

Step2

0.47889

13.2Hz

0.034527kg

Step3

0.38763

13.9Hz

0.035606kg

Step4

0.11831

16.4Hz

0.037764kg

Step5

0.07436

18.0Hz

0.039922kg

What it would be liked to focus on here is that with the IEDE change method, the objective value can be obtained after 6 eigen value analysis with a much shorter CPU than with conventional optimal analysis where 244 optimal analysis are necessary. As the model grows, this difference becomes even larger.
5. Conclusion
At the design site, there is a desire to move multiple eigen frequencies at the same time.
Topology optimization method is considered to be the most effective method to meet this request and so there are already many related studies. Here, it was also tried to the topology density method with using eigen value index to control multiple eigen frequencies simultaneously. However, there is no way to determine whether the problem can be converged in the first place and so after trial and error, it was shown an example that converged and an example that did not converge. Moreover, even if convergence is achieved, the structural shape obtained by the topology optimization analysis will be uneven and so if left as is, manufacturing costs would be extremely high. Therefore, as an actual design specification, holes are often made below a certain thickness from the current structure. As the result, it was shown that structure may deviate from the goal again. Therefore, returning to the origin of vibration, each eigen frequency is determined by equivalent stiffness and equivalent mass, the IEDT change method was developed. With traditional topology optimization analysis, the optimized solution is obtained with the design variables distributed in that state while maintaining the current topology. On the other hand, with the proposed IEDT change method the solution can be found interactively while change the topology by predicting the direction of change of each eigen frequency with referring to strain and kinematic energy density distributions. This means that with the proposed method, it was shown that the desired solution could be obtained more reliably in a short time from a wider solution space. It was also shown that the new method can also be used for preprocessing such as determining the appropriateness of task settings with traditional methods.
Lastly, it was shown that this IEDT change method is not only effective to reduce the peak response value but also much more effective in reducing integral value of response value within band than the traditional optimization analysis for minimization of the integral value.
Abbreviations
IEDT: Interactive Energy Distribution Topology
Acknoledgments
This research is partially supported by Grants-in-aid for Scientific Research 22K14207. We would like to express our deep appreciation here.
Conflicts of Interest
The authors declares no conflict of interest.
References
[1] Sasaki, T., Yang, Y., Hagiwara, I., Proposition of a New High Speed and High Efficiency Control Method for Plural Eigen Frequencies by Change Topology, International Journal of Mechanical Engineering and Applications 10(6), 2022-11, pp. 135-143.
[2] Sasaki, T., Hagiwara, I., Proposition of an energy density topology change method for plural eigen frequencies control, Transactions of the JSME (in Japanese), Vol. 89, No. 927 (2023),
[3] Bendsoe, M. P. and Kikuchi, N., Generating Optimal Topologies in Structural Design using a Homogenization method, Computer Methods in Applied Mechanics and Engineering, 71, (1988), pp. 197-224.
[4] Suzuki, K. and Kikuchi, N., A homogenization method for shape and topology optimization, Computer Methods in Applied Mechanics and Engineering, Volume 93, (1991), pp. 291-318.
[5] Ma, Z. D., Kikuchi, N., Cheng, H. C. and Hagiwara, I., Development of Structural Optimization Method for Vibration Reduction (1st Report, Structural Optimization Theory Using the Homogenization Method), JSME Series C, Vol. 59, No. 562 (1993-6), pp. 1730-1736 (in Japanese).
[6] Tenek, L. H., Hagiwara, I., Static and Vibrational Shape and Topology Optimization Using Homogenization and Mathematical Programming. Computer Methods in Applied Mechanics and Engineering, 109, (1993) pp. 143-154.
[7] Torigaki, T., Hagiwara, I., Kitagawa, Y., Ueda, M., Ma, Z. D., Kikuchi, N., Development and Application of a Shape-Topology Optimization System Using a Homogenization Method, SAE International Congress and Exposition. (1994-3).
[8] Ma, Z. D., Kikuchi, N., Hagiwara, I., Torigaki, T., Development of Structural Optimization Method for Vibration Reduction, (2nd Report, An Improved Algorithm for the Optimization Problem), JSME Series C, Vol. 60, No. 577 (1994-9), pp. 3018-3024 (in Japanese).
[9] Ma, Z. D., Kikuchi, N., Cheng, H. C., Hagiwara, I., Topological Optimization Technique for Free Vibration Problems, ASME Journal of Applied Mechanics, Vol. 62 (1995-3), pp. 201-207.
[10] Hassani B., Hinton, E., A review of homogenization and topology optimization I—homogenization theory for media with periodic structure, Computers & Structures, Volume 69, Issue 6, December 1998, pp. 707-717.
[11] Allaire, G., Cavallina, L., Miyake, N., Oka, T., Yachimura, T., The Homogenization Method for Topology Optimization of Structures: Old and New, JOURNAL FREE ACCESS, 2019 Volume 25 Issue 2 Pages 75-146.
[12] Tenek, L. H., Hagiwara, I., Optimal plate and shell topologies using thickness distribution or homogenization, Computer Methods in Applied Mechanics and Engineering, Vol. 115 Nos. 1 & 2 (1994), pp. 111-124.
[13] Fujii, D., Suzuki, K., Otsubo, H., Filtering method for topology optimization analysis using optimality criteria method, The Architectural Institute of Japan's Journal of Structural and Construction Engineering, No. 543(2001), pp. 105-112(in Japanese).
[14] Kishida, M., Kurahashi, T., Consideration on numerical parameters in density update equation used in the density base topology optimization, Bulletin of the Japan Society for Computational Methods in Engineering, Vol. 21, Paper No. 03-211218 (2021), pp. 17-26 (in Japanese).
[15] Nishio, Y., Liu, Y., Ono, N., Boundary shape identification method for density based topology optimization, Transactions of the JSME (in Japanese), Vol. 88, No. 914 (2022),
[16] Mike, J. D., Powell, A., Direct search optimization method that models the objective and constraint functions by linear interpolation”, Proc. Sixth Workshop on Optimization and Numerical Analysis, Vol. 275, pp. 51-67, Kluwer Academic Publishers, Dordrecht, NL, 1994.
[17] COMSOL Multiphysics® v. 5. 5.
[18] Kozukue, W., Hagiwara, I., Vehicle Interior Noise Reduction Analysis Using Sound Pressure Level Integral Sensitivity, JSME, series C, Vol. 59, No. 568 (1993-12), pp. 3845-3851 (in Japanese).
[19] Kozukue, W., Hagiwara, I., Vehicle Interior Noise Reduction Analysis Using Sound Pressure Level Integral Sensitivity, JSME, series C, Vol. 61, No. 586 (1995-7), pp. 2746-2752 (in Japanese).
[20] Abe, A., Hagiwara, I., Development of New Sound Insulation Simulation Technology Using Finite Element Method for Efficiency of High Aspect Ratio Core in Low Frequency Range, International Journal of Mechanical Engineering and Applications, Vol. 10, No. 1 (2022-2), pp. 7-16.
Cite This Article
  • APA Style

    Yang, Y., Sasaki, T., Abe, A., Hagiwara, I. (2024). The Outstanding Excellences of Interactive Energy Density Topology Change Method . International Journal of Mechanical Engineering and Applications, 12(2), 37-49. https://doi.org/10.11648/j.ijmea.20241202.11

    Copy | Download

    ACS Style

    Yang, Y.; Sasaki, T.; Abe, A.; Hagiwara, I. The Outstanding Excellences of Interactive Energy Density Topology Change Method . Int. J. Mech. Eng. Appl. 2024, 12(2), 37-49. doi: 10.11648/j.ijmea.20241202.11

    Copy | Download

    AMA Style

    Yang Y, Sasaki T, Abe A, Hagiwara I. The Outstanding Excellences of Interactive Energy Density Topology Change Method . Int J Mech Eng Appl. 2024;12(2):37-49. doi: 10.11648/j.ijmea.20241202.11

    Copy | Download

  • @article{10.11648/j.ijmea.20241202.11,
      author = {Yang Yang and Toshie Sasaki and Aya Abe and Ichiro Hagiwara},
      title = {The Outstanding Excellences of Interactive Energy Density Topology Change Method
    },
      journal = {International Journal of Mechanical Engineering and Applications},
      volume = {12},
      number = {2},
      pages = {37-49},
      doi = {10.11648/j.ijmea.20241202.11},
      url = {https://doi.org/10.11648/j.ijmea.20241202.11},
      eprint = {https://article.sciencepublishinggroup.com/pdf/10.11648.j.ijmea.20241202.11},
      abstract = {It has not been solved that the fruits, vegetables, strawberries, cells, blood and a bottle of liquor are damaged, broken during transportation. It is the greatest factor in this situation that there is a danger vibration frequency band where these are easy to scratch and are prone to death. If there are eigen frequencies within this danger frequency band, it needs that those eigen frequencies within this danger frequency band are moved out of the band. In the former paper, it was shown difficult to apply the existing topology optimization methods using homogenization method or density method to control plural eigen frequencies for solving this problem. Therefore in the former paper, it was proposed the so called “Interactive Energy Density Topology (IEDT) change method” that is a new high precision and high efficiency method for controlling plural eigen frequencies simultaneously referring to the kinetic and the strain energy density distributions. Here it is discussed more about the IEDT change method and show that it is sometimes difficult for the traditional methods to get solutions because especially in the dynamic problem, eigen frequencies may go up or down depending on its size even if reinforcement or hall for change topology is applied at the same location. But with the proposed IEDT change method, always it can be realized because the proposed method has wider solution spaces than the traditional one. Lastly, it is shown that this IEDT method is also very effective to reduce the integral value of response curve by frequency.
    },
     year = {2024}
    }
    

    Copy | Download

  • TY  - JOUR
    T1  - The Outstanding Excellences of Interactive Energy Density Topology Change Method
    
    AU  - Yang Yang
    AU  - Toshie Sasaki
    AU  - Aya Abe
    AU  - Ichiro Hagiwara
    Y1  - 2024/04/02
    PY  - 2024
    N1  - https://doi.org/10.11648/j.ijmea.20241202.11
    DO  - 10.11648/j.ijmea.20241202.11
    T2  - International Journal of Mechanical Engineering and Applications
    JF  - International Journal of Mechanical Engineering and Applications
    JO  - International Journal of Mechanical Engineering and Applications
    SP  - 37
    EP  - 49
    PB  - Science Publishing Group
    SN  - 2330-0248
    UR  - https://doi.org/10.11648/j.ijmea.20241202.11
    AB  - It has not been solved that the fruits, vegetables, strawberries, cells, blood and a bottle of liquor are damaged, broken during transportation. It is the greatest factor in this situation that there is a danger vibration frequency band where these are easy to scratch and are prone to death. If there are eigen frequencies within this danger frequency band, it needs that those eigen frequencies within this danger frequency band are moved out of the band. In the former paper, it was shown difficult to apply the existing topology optimization methods using homogenization method or density method to control plural eigen frequencies for solving this problem. Therefore in the former paper, it was proposed the so called “Interactive Energy Density Topology (IEDT) change method” that is a new high precision and high efficiency method for controlling plural eigen frequencies simultaneously referring to the kinetic and the strain energy density distributions. Here it is discussed more about the IEDT change method and show that it is sometimes difficult for the traditional methods to get solutions because especially in the dynamic problem, eigen frequencies may go up or down depending on its size even if reinforcement or hall for change topology is applied at the same location. But with the proposed IEDT change method, always it can be realized because the proposed method has wider solution spaces than the traditional one. Lastly, it is shown that this IEDT method is also very effective to reduce the integral value of response curve by frequency.
    
    VL  - 12
    IS  - 2
    ER  - 

    Copy | Download

Author Information
  • Abstract
  • Keywords
  • Document Sections

    1. 1. Introduction
    2. 2. Topology Optimization Method Using Traditional Density Method and New Proposed Method
    3. 3. Application of IEDT Change Method and Consideration
    4. 4. Minimization of Frequency Response Integral Value in Danger Frequency Band
    5. 5. Conclusion
    Show Full Outline
  • Abbreviations
  • Acknoledgments
  • Conflicts of Interest
  • References
  • Cite This Article
  • Author Information