Rainfall is one of the most critical climatic variables for investigating the impacts of climate change. Global Climate Models (GCMs) are widely used tools for examining changes in the climate system and projecting future climate scenarios. This study evaluated the performance of Coupled Model Intercomparison Project Phase 6 (CMIP6) Global Climate Models in simulating rainfall climatology over Ethiopia. Eight CMIP6 GCMs were assessed at daily, monthly, and annual timescales across five Agro-Ecological Zones (AEZs) of Ethiopia for the period 1995–2014, using station observations as reference data. Model performance was evaluated using Root Mean Square Error (RMSE), Percent Bias (PBIAS), and Pearson’s correlation coefficient (r). Each model was ranked using the Comprehensive Rating Index (CRI). The results showed that model performance varied considerably for daily to annual rainfall totals across the AEZs, with both overestimation and underestimation observed. For daily rainfall, EC-Earth3-Veg performed best in tropical, subtropical, and temperate AEZs; MRI-ESM2-0 performed best in the desert AEZ; and MPI-ESM1-2-LR performed best in the alpine AEZ. BCC-CSM2-MR performed well across tropical, subtropical, temperate, and alpine AEZs, while MRI-ESM2-0 performed better in desert AEZs. For annual rainfall, MRI-ESM2-0 was superior in desert and tropical AEZs, BCC-CSM2-MR performed best in temperate and alpine AEZs, and EC-Earth3-Veg performed best in the subtropical AEZ. EC-Earth3 was the least effective at reproducing mean monthly rainfall. Overall, the models’ performance was inconsistent across timescales and regions. Given the spatial and temporal variability in CMIP6 GCM performance, it is recommended that models be thoroughly evaluated and bias-corrected for specific locations and intended applications, particularly regarding their ability to simulate Ethiopia’s diverse rainfall regimes.
| Published in | International Journal of Systems Science and Applied Mathematics (Volume 11, Issue 2) |
| DOI | 10.11648/j.ijssam.20261102.12 |
| Page(s) | 32-52 |
| Creative Commons |
This is an Open Access article, distributed under the terms of the Creative Commons Attribution 4.0 International License (http://creativecommons.org/licenses/by/4.0/), which permits unrestricted use, distribution and reproduction in any medium or format, provided the original work is properly cited. |
| Copyright |
Copyright © The Author(s), 2026. Published by Science Publishing Group |
AEZs, CMIP6, GCMs, Rainfall, Model Performance Evaluation, Ethiopia
Number | CMIP6 model | Institute | Country | Resolution | Variant label |
|---|---|---|---|---|---|
1 | ACCESS-ESM1-5 | Australian Community Climate and Earth System Simulator | Australia | 1.9°×1.2° | r1i1p1f1 |
2 | BCC-CSM2-MR | Beijing Climate Center (BCC) | China | 1.1°×1.1° | r1i1p1f1 |
3 | CNRM-CM6-1 | Recherché Météorologiques | France | 1.4 × 1.4◦ | r1i1p1f2 |
4 | EC-Earth3 | EC-Earth-Consortium | Sweden | 0.7° × 0.7° | r1i1p1f1 |
5 | EC-Earth3-veg | EC-Earth-Consortium | Sweden | 0.7° × 0.7° | r1i1p1f1 |
6 | MPI-ESM1-2-LR | Max-Planck-Institute für Meteorology | Germany | 1.9°×1.9° | r1i1p1f1 |
7 | MRI-ESM2-0 | Meteorological Research Institute | Japan | 1.1°×1.1° | r1i1p1f1 |
8 | GFDL-ESM4 | Geophysical fluid dynamics laboratory | USA | 1.25°×1.00° | r1i1p1f1 |
AEZs | CMIP6 Models | Continuous Statistical Metrics | CRI | Rank | ||
|---|---|---|---|---|---|---|
RMSE | PBIAS | r | ||||
Desert | ACCESS-ESM-1-5 | 4.49 | 64.10 | 0.05 | 0.42 | 5 |
BCC-CSM-2-MR | 4.00 | -16.40 | 0.04 | 0.58 | 3 | |
CNRM-CM6-1 | 4.07 | 48.50 | 0.00 | 0.21 | 7 | |
EC-Earth3 | 3.43 | 91.90 | 0.03 | 0.46 | 4 | |
EC-Earth3-veg | 3.82 | 11.10 | 0.04 | 0.71 | 2 | |
GFDL-ESM4 | 5.63 | -128.80 | 0.01 | 0.08 | 8 | |
MPI-ESM1-2-LR | 3.86 | 47.90 | 0.01 | 0.42 | 5 | |
MRI-ESM2-0 | 3.81 | 3.00 | 0.04 | 0.79 | 1 | |
Tropical | ACCESS-ESM-1-5 | 4.06 | -30.80 | 0.28 | 0.54 | 3 |
BCC-CSM-2-MR | 5.49 | -30.30 | 0.20 | 0.29 | 7 | |
CNRM-CM6-1 | 3.76 | 58.40 | 0.12 | 0.29 | 7 | |
EC-Earth3 | 3.80 | 91.60 | 0.28 | 0.46 | 4 | |
EC-Earth3-veg | 3.51 | 11.40 | 0.23 | 0.63 | 1 | |
GFDL-ESM4 | 4.55 | -10.50 | 0.19 | 0.38 | 6 | |
MPI-ESM1-2-LR | 3.28 | 38.40 | 0.27 | 0.58 | 2 | |
MRI-ESM2-0 | 4.06 | -6.20 | 0.10 | 0.42 | 5 | |
Sub-tropical | ACCESS-ESM-1-5 | 5.34 | 37.10 | 0.41 | 0.29 | 6 |
BCC-CSM-2-MR | 5.74 | -19.80 | 0.32 | 0.25 | 7 | |
CNRM-CM6-1 | 4.20 | 46.40 | 0.19 | 0.25 | 7 | |
EC-Earth3 | 4.31 | 90.70 | 0.55 | 0.42 | 4 | |
EC-Earth3-veg | 3.45 | 1.60 | 0.49 | 0.79 | 1 | |
GFDL-ESM4 | 4.69 | -3.50 | 0.35 | 0.42 | 4 | |
MPI-ESM1-2-LR | 3.26 | 32.10 | 0.47 | 0.67 | 2 | |
MRI-ESM2-0 | 4.27 | -32.10 | 0.39 | 0.46 | 3 | |
Temperate | ACCESS-ESM-1-5 | 5.66 | -50.10 | 0.38 | 0.21 | 8 |
BCC-CSM-2-MR | 5.73 | 1.00 | 0.28 | 0.33 | 7 | |
CNRM-CM6-1 | 4.85 | -17.30 | 0.28 | 0.38 | 5 | |
EC-Earth3 | 4.77 | 89.60 | 0.53 | 0.50 | 3 | |
EC-Earth3-veg | 4.26 | -9.20 | 0.47 | 0.75 | 1 | |
GFDL-ESM4 | 5.17 | -3.90 | 0.33 | 0.38 | 5 | |
MPI-ESM1-2-LR | 3.96 | 30.10 | 0.42 | 0.58 | 2 | |
MRI-ESM2-0 | 5.13 | -35.00 | 0.44 | 0.42 | 4 | |
Alpine | ACCESS-ESM-1-5 | 7.29 | 23.30 | 0.28 | 0.54 | 2 |
BCC-CSM-2-MR | 7.76 | 9.80 | 0.18 | 0.42 | 4 | |
CNRM-CM6-1 | 7.51 | 36.60 | 0.07 | 0.29 | 6 | |
EC-Earth3 | 6.56 | 86.00 | 0.31 | 0.50 | 3 | |
EC-Earth3-veg | 7.67 | -48.30 | 0.29 | 0.29 | 6 | |
GFDL-ESM4 | 7.81 | -15.60 | 0.17 | 0.29 | 6 | |
MPI-ESM1-2-LR | 6.28 | 24.60 | 0.33 | 0.75 | 1 | |
MRI-ESM2-0 | 7.57 | -39.00 | 0.30 | 0.42 | 4 | |
AEZs | CMIP6 Models | Continuous statistical metrics | CRI | Rank | ||
|---|---|---|---|---|---|---|
RMSE | PBIAS | r | ||||
Desert | ACCESS-ESM-1-5 | 55.33 | -178.40 | 0.40 | 0.13 | 8 |
BCC-CSM-2-MR | 31.44 | -16.40 | 0.05 | 0.46 | 4 | |
CNRM-CM6-1 | 38.83 | 48.50 | -0.04 | 0.21 | 7 | |
EC-Earth3 | 30.08 | 91.80 | 0.37 | 0.63 | 3 | |
EC-Earth3-veg | 29.98 | 11.10 | 0.33 | 0.75 | 1 | |
GFDL-ESM4 | 50.78 | -128.60 | 0.31 | 0.25 | 6 | |
MPI-ESM1-2-LR | 37.11 | 48.00 | 0.00 | 0.33 | 5 | |
MRI-ESM2-0 | 30.18 | 3.00 | 0.36 | 0.75 | 1 | |
Tropical | ACCESS-ESM-1-5 | 73.12 | -30.80 | 0.63 | 0.33 | 6 |
BCC-CSM-2-MR | 53.03 | -30.30 | 0.74 | 0.71 | 1 | |
CNRM-CM6-1 | 70.16 | 58.40 | 0.36 | 0.21 | 7 | |
EC-Earth3 | 89.53 | 91.60 | 0.65 | 0.21 | 7 | |
EC-Earth3-veg | 57.18 | 11.40 | 0.55 | 0.50 | 4 | |
GFDL-ESM4 | 57.26 | -10.80 | 0.61 | 0.54 | 3 | |
MPI-ESM1-2-LR | 48.20 | 38.30 | 0.70 | 0.63 | 2 | |
MRI-ESM2-0 | 70.76 | -6.20 | 0.23 | 0.38 | 5 | |
Sub-tropical | ACCESS-ESM-1-5 | 116.04 | -58.90 | 0.67 | 0.08 | 8 |
BCC-CSM-2-MR | 52.14 | -19.80 | 0.85 | 0.79 | 1 | |
CNRM-CM6-1 | 85.53 | 46.40 | 0.42 | 0.17 | 7 | |
EC-Earth3 | 115.35 | 90.70 | 0.85 | 0.33 | 6 | |
EC-Earth3-veg | 60.61 | 1.60 | 0.77 | 0.63 | 2 | |
GFDL-ESM4 | 58.01 | -3.50 | 0.75 | 0.58 | 4 | |
MPI-ESM1-2-LR | 52.91 | 32.10 | 0.84 | 0.63 | 2 | |
MRI-ESM2-0 | 68.50 | -32.10 | 0.73 | 0.38 | 5 | |
Temperate | ACCESS-ESM-1-5 | 108.05 | -50.10 | 0.69 | 0.13 | 8 |
BCC-CSM-2-MR | 46.67 | 0.90 | 0.85 | 0.83 | 1 | |
CNRM-CM6-1 | 74.66 | 17.30 | 0.61 | 0.29 | 6 | |
EC-Earth3 | 116.44 | 89.60 | 0.89 | 0.29 | 6 | |
EC-Earth3-veg | 67.02 | -9.30 | 0.79 | 0.50 | 4 | |
GFDL-ESM4 | 59.35 | -3.90 | 0.77 | 0.54 | 3 | |
MPI-ESM1-2-LR | 58.52 | 30.00 | 0.82 | 0.58 | 2 | |
MRI-ESM2-0 | 75.12 | -35.00 | 0.81 | 0.33 | 5 | |
Alpine | ACCESS-ESM-1-5 | 150.66 | -18.60 | 0.33 | 0.67 | 1 |
BCC-CSM-2-MR | 144.58 | 18.10 | 0.14 | 0.67 | 1 | |
CNRM-CM6-1 | 145.42 | 42.30 | 0.13 | 0.38 | 5 | |
EC-Earth3 | 152.26 | 87.30 | 0.26 | 0.38 | 5 | |
EC-Earth3-veg | 172.89 | -34.90 | 0.22 | 0.33 | 7 | |
GFDL-ESM4 | 154.37 | -5.00 | 0.04 | 0.42 | 4 | |
MPI-ESM1-2-LR | 147.56 | 31.40 | 0.15 | 0.50 | 3 | |
MRI-ESM2-0 | 182.12 | -26.50 | 0.03 | 0.17 | 8 | |
AEZs | CMIP6 Models | Continuous statistical metrics | CRI | Rank | ||
|---|---|---|---|---|---|---|
RMSE | PBIAS | r | ||||
Desert | ACCESS-ESM-1-5 | 395.63 | -178.40 | -0.09 | 0.04 | 8 |
BCC-CSM-2-MR | 86.36 | -16.40 | 0.19 | 0.67 | 2 | |
CNRM-CM6-1 | 122.82 | 48.60 | 0.58 | 0.58 | 3 | |
EC-Earth3 | 196.44 | 91.90 | -0.05 | 0.29 | 6 | |
EC-Earth3-veg | 120.08 | 11.20 | -0.08 | 0.54 | 4 | |
GFDL-ESM4 | 303.17 | -128.50 | -0.14 | 0.08 | 7 | |
MPI-ESM1-2-LR | 133.78 | 47.90 | 0.01 | 0.46 | 5 | |
MRI-ESM2-0 | 79.64 | 3.10 | 0.30 | 0.83 | 1 | |
Tropical | ACCESS-ESM-1-5 | 390.48 | -30.80 | -0.04 | 0.38 | 4 |
BCC-CSM-2-MR | 365.78 | -30.30 | -0.08 | 0.33 | 6 | |
CNRM-CM6-1 | 607.75 | 58.40 | 0.31 | 0.38 | 4 | |
EC-Earth3 | 939.32 | 91.60 | 0.13 | 0.25 | 7 | |
EC-Earth3-veg | 283.79 | 11.40 | 0.03 | 0.63 | 3 | |
GFDL-ESM4 | 214.79 | -10.50 | 0.00 | 0.67 | 2 | |
MPI-ESM1-2-LR | 415.80 | 38.30 | -0.36 | 0.17 | 8 | |
MRI-ESM2-0 | 263.41 | -6.20 | 0.03 | 0.25 | 1 | |
Sub-tropical | ACCESS-ESM-1-5 | 783.92 | -58.90 | 0.01 | 0.29 | 7 |
BCC-CSM-2-MR | 302.63 | -19.80 | 0.00 | 0.58 | 3 | |
CNRM-CM6-1 | 595.74 | 46.40 | 0.25 | 0.46 | 4 | |
EC-Earth3 | 1124.94 | 90.70 | -0.01 | 0.13 | 8 | |
EC-Earth3-veg | 241.70 | 1.60 | 0.14 | 0.79 | 1 | |
GFDL-ESM4 | 182.45 | -3.50 | -0.09 | 0.63 | 2 | |
MPI-ESM1-2-LR | 416.70 | 32.10 | -0.13 | 0.33 | 5 | |
MRI-ESM2-0 | 465.18 | -32.10 | -0.11 | 0.33 | 5 | |
Temperate | ACCESS-ESM-1-5 | 640.95 | -50.10 | 0.11 | 0.25 | 6 |
BCC-CSM-2-MR | 146.43 | 0.90 | 0.23 | 0.79 | 1 | |
CNRM-CM6-1 | 281.53 | 17.30 | 0.26 | 0.63 | 3 | |
EC-Earth3 | 1033.63 | 89.60 | 0.04 | 0.13 | 8 | |
EC-Earth3-veg | 262.16 | -9.30 | 0.24 | 0.67 | 2 | |
GFDL-ESM4 | 161.48 | -3.90 | -0.01 | 0.58 | 4 | |
MPI-ESM1-2-LR | 362.32 | 30.00 | -0.11 | 0.29 | 5 | |
MRI-ESM2-0 | 457.47 | -35.00 | -0.31 | 0.17 | 7 | |
Alpine | ACCESS-ESM-1-5 | 387.40 | -30.40 | 0.04 | 0.50 | 2 |
BCC-CSM-2-MR | 151.93 | 9.90 | 0.49 | 0.83 | 1 | |
CNRM-CM6-1 | 409.78 | 36.60 | 0.00 | 0.38 | 5 | |
EC-Earth3 | 821.05 | 86.00 | 0.17 | 0.21 | 8 | |
EC-Earth3-veg | 544.86 | -48.30 | 0.62 | 0.38 | 5 | |
GFDL-ESM4 | 268.02 | -15.50 | -0.36 | 0.50 | 2 | |
MPI-ESM1-2-LR | 276.54 | 24.60 | -0.28 | 0.46 | 4 | |
MRI-ESM2-0 | 437.75 | -39.10 | -0.27 | 0.25 | 7 | |
AEZs | Argo Ecology Zones |
CMIP | Coupled Model Inter-comparison Project |
CMIP6 | Coupled Model Inter-comparison Project Phase 6 |
CMIP5 | Coupled Model Inter-comparison Project Phase 5 |
CHCN-M | Global Historical Climatology Network |
CHIRPS | Climate Hazard Infrared Precipitation with Stations |
CMIP6 GCMs | Coupled Model Inter-comparison Project Phase 6 Global Climate Models |
CRU | Climate Research Unit |
CLIVAR | Climate Variability and Predictability |
CPC | Climate Prediction Center |
CRI | Critical Rating Index |
ENACTs | Enhanced Climate Services for Tropics |
ESGF | Earth System Grid Federation |
GCMs | Global Climate Models |
GPCC | Global Precipitation Climatology Center |
IPCC AR5 | International Panel on Climate Change Fifth Assessment report |
KGE | Kling Gupta Efficiency |
MAE | Mean Absolute Error |
ME | Mean Error |
NSE | Nash-Sutcliffe Efficiency |
PBIAS | Percent Bias |
PCMDI | Program for Climate Model Diagnosis and Inter-comparison |
PRECL | Precipitation Reconstruction over Land |
R | Pearson Correlation Coefficient |
R2 | Coefficient of determination |
RMSE | Root Mean Square Error |
UDEL | University of Delaware |
WCRP | World Climate Research Program |
No | Station Name | Geographic coordinate | Elevation | Traditional AEZs | ||
|---|---|---|---|---|---|---|
Longitude | Latitude | AEZs (Amharic name) | AEZs (English name) | |||
1 | Abomsa | 39.83 | 8.47 | 1630 | WoyinaDega | Subtropical |
2 | Adama | 39.28 | 8.56 | 1648 | WoyinaDega | Subtropical |
3 | Addis Ababa | 38.75 | 9.02 | 2386 | Dega | Temperate |
4 | Ambo | 37.84 | 8.99 | 2068 | WoyinaDega | Subtropical |
5 | Arba Minch | 37.56 | 6.06 | 1220 | Kolla | Tropical |
6 | AsebeTeferi | 40.87 | 9.07 | 1796 | Kolla | Tropical |
7 | Assela | 39.14 | 7.96 | 2420 | Dega | Temperate |
8 | Asgori | 38.33 | 8.79 | 1979 | WoyinaDega | Subtropical |
9 | Assosa | 34.55 | 10.05 | 1541 | WoyinaDega | Subtropical |
10 | Bahir Dar | 37.42 | 11.60 | 1770 | WoyinaDega | Subtropical |
11 | Boditi | 37.86 | 6.96 | 2043 | WoyinaDega | Subtropical |
12 | Bonga | 36.24 | 7.28 | 1599 | WoyinaDega | Subtropical |
13 | Butajira | 38.38 | 8.12 | 2074 | WoyinaDega | Subtropical |
14 | Dangila | 36.85 | 11.43 | 2116 | WoyinaDega | Subtropical |
15 | Debre Birhan | 39.51 | 9.67 | 3206 | Dega | Temperate |
16 | Debre Markos | 37.74 | 10.33 | 2446 | Dega | Temperate |
17 | Debretabor | 38.00 | 11.87 | 2612 | Dega | Temperate |
18 | Degehabur | 43.56 | 8.23 | 1070 | Kolla | Tropical |
19 | Dilla | 38.31 | 6.38 | 1515 | WoyinaDega | Subtropical |
20 | Dire Dawa | 41.90 | 9.61 | 1045 | Kolla | Tropical |
21 | Dubity | 41.09 | 11.73 | 381 | Bereha | Desert |
22 | Fiche | 38.74 | 9.77 | 2798 | Dega | Temperate |
23 | Gimbi | 35.84 | 9.20 | 1844 | WoyinaDega | Subtropical |
24 | Gonder | 37.43 | 12.52 | 1973 | WoyinaDega | Subtropical |
25 | Gore | 35.55 | 8.16 | 2024 | WoyinaDega | Subtropical |
26 | Haramaya | 42.04 | 9.42 | 2025 | WoyinaDega | Subtropical |
27 | Hawassa | 38.48 | 7.07 | 1694 | WoyinaDega | Subtropical |
28 | Hosanna | 37.86 | 7.57 | 2306 | Dega | Temperate |
29 | Jijiga | 42.72 | 9.37 | 1557 | WoyinaDega | Subtropical |
30 | Jimma | 36.82 | 7.67 | 1710 | WoyinaDega | Subtropical |
31 | Kombolcha | 39.72 | 11.08 | 1857 | WoyinaDega | Subtropical |
32 | Konso | 37.44 | 5.34 | 1431 | Kolla | Tropical |
33 | Lalibela | 39.04 | 12.04 | 2487 | Dega | Temperate |
34 | Mekele | 39.53 | 13.47 | 2221 | WoyinaDega | Subtropical |
35 | Metema | 36.41 | 12.77 | 790 | Kolla | Tropical |
36 | Mizan Teferi | 35.58 | 7.00 | 1444 | Kolla | Tropical |
37 | Mojo | 39.11 | 8.61 | 1763 | WoyinaDega | Subtropical |
38 | Moyale | 39.05 | 5.05 | 1166 | WoyinaDega | Subtropical |
39 | Negele | 39.27 | 5.33 | 1439 | WoyinaDega | Subtropical |
40 | Nekemte | 36.55 | 9.08 | 2119 | WoyinaDega | Subtropical |
41 | Pawe | 36.41 | 11.31 | 1119 | Kolla | Tropical |
42 | Robe | 40.05 | 7.13 | 2480 | Dega | Temperate |
43 | Teppi | 35.44 | 7.20 | 1208 | Kolla | Tropical |
44 | Tulu bolo | 38.22 | 8.67 | 2100 | WoyinaDega | Subtropical |
45 | Wolaita | 37.75 | 6.82 | 1854 | WoyinaDega | Subtropical |
46 | Yirgachefe | 38.21 | 6.15 | 1856 | WoyinaDega | Subtropical |
47 | Yirgalem | 38.43 | 6.80 | 1786 | WoyinaDega | Subtropical |
| [1] | Ageet, S., Fink, A. H., Maranan, M., Diem, J. E., Hartter, J., Ssali, A. L., & Ayabagabo, P. (2022). Validation of satellite rainfall estimates over equatorial East Africa. Journal of Hydrometeorology, 23(2), 129–151. |
| [2] | Alaminie, A. A., Tilahun, S. A., Legesse, S. A., Zimale, F. A., Tarkegn, G. B., & Jury, M. R. (2021). Evaluation of past and future climate trends under CMIP6 scenarios for the UBNB (Abay), Ethiopia. Water, 13(15), Article 2110. |
| [3] | Almazroui, M., Saeed, F., Saeed, S., Nazrul Islam, M., Ismail, M., Klutse, N. A. B., & Siddiqui, M. H. (2020). Projected change in temperature and precipitation over Africa from CMIP6. Earth Systems and Environment, 4, 455–475. |
| [4] | Berhanu, D., Alamirew, T., Taye, M. T., Tibebe, D., Gebrehiwot, S., & Zeleke, G. (2023). Evaluation of CMIP6 models in reproducing observed rainfall over Ethiopia. Journal of Water and Climate Change, 14(8), 2583–2605. |
| [5] | Chang, X., Guo, J., Qin, H., Huang, J., Wang, X., & Ren, P. (2024). Single-objective and multi-objective flood interval forecasting considering interval fitting coefficients. Water Resources Management. Advance online publication. |
| [6] | Cheung, W. H., Senay, G. B., & Singh, A. (2008). Trends and spatial distribution of annual and seasonal rainfall in Ethiopia. International Journal of Climatology, 28(13), 1723–1734. |
| [7] | Dangol, S., Talchabhadel, R., & Pandey, V. P. et al., 2022). Performance evaluation and bias correction of gridded precipitation products over Arun River Basin in Nepal for hydrological applications. Theoretical and Applied Climatology, 148(3–4), 1353–1372. |
| [8] | Degefu, M. A., & Bewket, W. (2023). Performance variations of global precipitation products in detecting drought episodes in three wet seasons in Ethiopia: Part II—statistical analysis. Meteorological Applications, 30(5), Article e2154. |
| [9] | Degefu, M. A., Bewket, W., & Amha, Y. (2022). Evaluating performance of 20 global and quasi-global precipitation products in representing drought events in Ethiopia I: Visual and correlation analysis. Weather and Climate Extremes, 35, Article 100416. |
| [10] | Dibaba, W. T., Miegel, K., & Demissie, T. A. (2019). Evaluation of the CORDEX regional climate models performance in simulating climate conditions of two catchments in Upper Blue Nile Basin. Dynamics of Atmospheres and Oceans, 87, Article 101104. |
| [11] | Diallo, I., et al. (2019). Projected changes in African precipitation or regional climate model evaluation over Africa |
| [12] | Dinku, T., Ceccato, P., Grover-Kopec, E., Lemma, M., Connor, S. J., & Ropelewski, C. F. (2007). Validation of satellite rainfall products over East Africa’s complex topography. International Journal of Remote Sensing, 28(7), 1503–1526. |
| [13] | Ding, Y., et al. (2024). [Recent climate/rainfall extremes paper – exact full citation not uniquely identified in search due to commonality; retain as cited in manuscript]. |
| [14] | Dyer, E., Hirons, L., & Taye, M. T. (2022). July–September rainfall in the Greater Horn of Africa: The combined influence of the Mascarene and South Atlantic highs. Climate Dynamics, 59(11), 3621–3641. |
| [15] | Dyer, E., Washington, R., & Taye, M. T. (2019). Evaluating the CMIP5 ensemble in Ethiopia: Creating a reduced ensemble for rainfall and temperature in Northwest Ethiopia and the Awash basin. International Journal of Climatology, 40(6), 3165–3180. |
| [16] | Edwards, P. N. (2011). History of climate modeling. Wiley Interdisciplinary Reviews: Climate Change, 2(1), 128–139. |
| [17] | Evangelista, P., Young, N., & Burnett, J. (2013). How will climate change spatially affect agriculture production in Ethiopia? Case studies of important cereal crops. Climatic Change, 119(3), 855–873. |
| [18] | Eyring, V., Bony, S., Meehl, G. A., Senior, C. A., Stevens, B., Stouffer, R. J., & Taylor, K. E. (2016). Overview of the Coupled Model Intercomparison Project Phase 6 (CMIP6) experimental design and organization. Geoscientific Model Development, 9(5), 1937–1958. |
| [19] | Fetene, M. C., et al. (2022). [CMIP6 evaluation over Ethiopian basins – see also related 2025 paper by Chanie et al. for similar work]. |
| [20] | Field, C. B., Barros, V. R., Mastrandrea, M. D., Mach, K. J., Abdrabo, M. A., Adger, W. N., … Yohe, G. W. (2015). Summary for policymakers. In Climate change 2014: Impacts, adaptation, and vulnerability. Part A: Global and sectoral aspects (pp. 1–32). Cambridge University Press. |
| [21] | Flato, G., Marotzke, J., Abiodun, B., Braconnot, P., Chou, S. C., Collins, W., … Rummukainen, M. (2014). Evaluation of climate models. In Climate change 2013: The physical science basis (pp. 741–866). Cambridge University Press. |
| [22] | Gashaw, T., Worqlul, A. W., Taye, M. T., Lakew, H. B., Seid, A., Ayele, G., & Haileslassie, A. (2024). Performance evaluations of CMIP6 model simulations and future projections of rainfall and temperature in the Bale Eco-Region, Southern Ethiopia. Theoretical and Applied Climatology. |
| [23] | Gebrechorkos, S. H., Hülsmann, S., & Bernhofer, C. (2019). Long-term trends in rainfall and temperature using high-resolution climate datasets in East Africa. Scientific Reports, 9(1), Article 11376. |
| [24] | Gebrechorkos, S., Leyland, J., Slater, L., Wortmann, M., Ashworth, P. J., Bennett, G. L., … Dadson, S. (2023). A high-resolution daily global dataset of statistically downscaled CMIP6 models for climate impact analyses. Scientific Data, 10(1), Article 611. |
| [25] | Guo, H., Bao, A., Chen, T., Zheng, G., Wang, Y., Jiang, L., & De Maeyer, P. (2021). Assessment of CMIP6 in simulating precipitation over arid Central Asia. Atmospheric Research, 252, Article 105451. |
| [26] | Guo, J., et al. (2024). [Recent paper on extreme rainfall or climate impacts – exact match not isolated; commonly cited in 2024 contexts]. |
| [27] | Iqbal, Z., Shahid, S., Ahmed, K., Ismail, T., Ziarh, G. F., Chung, E.-S., & Wang, X. (2021). Evaluation of CMIP6 GCM rainfall in mainland Southeast Asia. Atmospheric Research, 254, Article 105525. |
| [28] | Jury, M. R. (2015). Statistical evaluation of CMIP5 climate change model simulations for the Ethiopian highlands. International Journal of Climatology, 35(1), 37–48. |
| [29] | Kindt, R., van Breugel, P., Lillesø, J. P. B., Minani, V., Ruffo, C. K., Gapusi, J., Jamnadass, R., & Graudal, L. (2014). Potential natural vegetation of Eastern Africa (Ethiopia, Kenya, Malawi, Rwanda, Tanzania, Uganda and Zambia). Volume 9. Atlas and tree species composition for Rwanda. Department of Geosciences and Natural Resource Management, University of Copenhagen. |
| [30] | Legates, D. R., & McCabe, G. J., Jr. (1999). Evaluating the use of “goodness-of-fit” measures in hydrologic and hydroclimatic model validation. Water Resources Research, 35(1), 233–241. |
| [31] | Li, L., et al. (2016). CMIP5 model simulations of Ethiopian Kiremt-season precipitation: Current climate and future changes. Climate Dynamics, 46(9-10), 2883–2895. |
| [32] | Mohammed, J. A. (2024). Performance evaluation and ranking of CMIP6 global climate models over upper Blue Nile (Abbay) basin of Ethiopia. Natural Hazards Research. Advance online publication. |
| [33] | Mohammed, J. A., & Yimam, Z. A. (2022). Spatiotemporal variability and trend analysis of rainfall in Beshilo sub-basin, Upper Blue Nile (Abbay) Basin of Ethiopia. Arabian Journal of Geosciences, 15(16), Article 1387. |
| [34] | MOA. (1998). Agro-ecological zones of Ethiopia. Ministry of Agriculture. |
| [35] | Omay, P. O., Muthama, N. J., Oludhe, C., Kinama, J. M., Artan, G., & Atheru, Z. (2023). Evaluation of CMIP6 historical simulations over IGAD region of Eastern Africa. Preprint. |
| [36] | Polong, F., Pham, Q. B., Anh, D. T., Rahman, K. U., Shahid, M., & Alharbi, R. S. (2023). Evaluation and comparison of four satellite-based precipitation products over the upper Tana River Basin. International Journal of Environmental Science and Technology, 20(1), 843–858. |
| [37] | Taylor, K. E. (2001). Summarizing multiple aspects of model performance in a single diagram. Journal of Geophysical Research: Atmospheres, 106(D7), 7183–7192. |
| [38] | Taylor, K. E., Stouffer, R. J., & Meehl, G. A. (2012). An overview of CMIP5 and the experiment design. Bulletin of the American Meteorological Society, 93(4), 485–498. |
| [39] | Weber, T., et al. 2020). Analysis of compound climate extremes and exposed population in Africa. Earth's Future. |
| [40] | WMO. (2009). Guidelines on analysis of extremes in a changing climate in support of informed decisions for adaptation. World Meteorological Organization. |
| [41] | Worku, G., Teferi, E., Bantider, A., & Dile, Y. T. (2018). Evaluation of regional climate models performance in simulating rainfall climatology of Jemma sub-basin, Upper Blue Nile Basin, Ethiopia. Dynamics of Atmospheres and Oceans, 83, 53–63. |
| [42] | Worku, G., Teferi, E., Bantider, A., Dile, Y. T., & Taye, M. T. (2019). Observed changes in extremes of daily rainfall and temperature in Jemma Sub-Basin, Upper Blue Nile Basin, Ethiopia. Theoretical and Applied Climatology, 135, 839–854. |
| [43] | Wubaye, G. B., Gashaw, T., Worqlul, A. W., Dile, Y. T., Taye, M. T., Haileslassie, A., Zaitchik, B., Birhan, D. A., Adgo, E., & Mohammed, J. A. (2023). Trends in rainfall and temperature extremes in Ethiopia: Station and agro-ecological zone levels of analysis. Atmosphere, 14(3), Article 483. |
| [44] | Zhang, X., & Yang, F. (2004). RClimDex (1.0) user manual. Climate Research Branch, Environment Canada. |
APA Style
Solomon, T., Yimam, Y. A. (2026). Evaluation of CMIP6 Global Climate Models for Rainfall Simulation Across Agro-Ecological Zones of Ethiopia. International Journal of Systems Science and Applied Mathematics, 11(2), 32-52. https://doi.org/10.11648/j.ijssam.20261102.12
ACS Style
Solomon, T.; Yimam, Y. A. Evaluation of CMIP6 Global Climate Models for Rainfall Simulation Across Agro-Ecological Zones of Ethiopia. Int. J. Syst. Sci. Appl. Math. 2026, 11(2), 32-52. doi: 10.11648/j.ijssam.20261102.12
@article{10.11648/j.ijssam.20261102.12,
  author = {Tewodros Solomon and Yimer Assefa Yimam},
  title = {Evaluation of CMIP6 Global Climate Models for Rainfall Simulation Across Agro-Ecological Zones of Ethiopia},
  journal = {International Journal of Systems Science and Applied Mathematics},
  volume = {11},
  number = {2},
  pages = {32-52},
  doi = {10.11648/j.ijssam.20261102.12},
  url = {https://doi.org/10.11648/j.ijssam.20261102.12},
  eprint = {https://article.sciencepublishinggroup.com/pdf/10.11648.j.ijssam.20261102.12},
  abstract = {Rainfall is one of the most critical climatic variables for investigating the impacts of climate change. Global Climate Models (GCMs) are widely used tools for examining changes in the climate system and projecting future climate scenarios. This study evaluated the performance of Coupled Model Intercomparison Project Phase 6 (CMIP6) Global Climate Models in simulating rainfall climatology over Ethiopia. Eight CMIP6 GCMs were assessed at daily, monthly, and annual timescales across five Agro-Ecological Zones (AEZs) of Ethiopia for the period 1995–2014, using station observations as reference data. Model performance was evaluated using Root Mean Square Error (RMSE), Percent Bias (PBIAS), and Pearson’s correlation coefficient (r). Each model was ranked using the Comprehensive Rating Index (CRI). The results showed that model performance varied considerably for daily to annual rainfall totals across the AEZs, with both overestimation and underestimation observed. For daily rainfall, EC-Earth3-Veg performed best in tropical, subtropical, and temperate AEZs; MRI-ESM2-0 performed best in the desert AEZ; and MPI-ESM1-2-LR performed best in the alpine AEZ. BCC-CSM2-MR performed well across tropical, subtropical, temperate, and alpine AEZs, while MRI-ESM2-0 performed better in desert AEZs. For annual rainfall, MRI-ESM2-0 was superior in desert and tropical AEZs, BCC-CSM2-MR performed best in temperate and alpine AEZs, and EC-Earth3-Veg performed best in the subtropical AEZ. EC-Earth3 was the least effective at reproducing mean monthly rainfall. Overall, the models’ performance was inconsistent across timescales and regions. Given the spatial and temporal variability in CMIP6 GCM performance, it is recommended that models be thoroughly evaluated and bias-corrected for specific locations and intended applications, particularly regarding their ability to simulate Ethiopia’s diverse rainfall regimes.},
 year = {2026}
}
TY  - JOUR
T1  - Evaluation of CMIP6 Global Climate Models for Rainfall Simulation Across Agro-Ecological Zones of Ethiopia
AU  - Tewodros Solomon
AU  - Yimer Assefa Yimam
Y1  - 2026/06/04
PY  - 2026
N1  - https://doi.org/10.11648/j.ijssam.20261102.12
DO  - 10.11648/j.ijssam.20261102.12
T2  - International Journal of Systems Science and Applied Mathematics
JF  - International Journal of Systems Science and Applied Mathematics
JO  - International Journal of Systems Science and Applied Mathematics
SP  - 32
EP  - 52
PB  - Science Publishing Group
SN  - 2575-5803
UR  - https://doi.org/10.11648/j.ijssam.20261102.12
AB  - Rainfall is one of the most critical climatic variables for investigating the impacts of climate change. Global Climate Models (GCMs) are widely used tools for examining changes in the climate system and projecting future climate scenarios. This study evaluated the performance of Coupled Model Intercomparison Project Phase 6 (CMIP6) Global Climate Models in simulating rainfall climatology over Ethiopia. Eight CMIP6 GCMs were assessed at daily, monthly, and annual timescales across five Agro-Ecological Zones (AEZs) of Ethiopia for the period 1995–2014, using station observations as reference data. Model performance was evaluated using Root Mean Square Error (RMSE), Percent Bias (PBIAS), and Pearson’s correlation coefficient (r). Each model was ranked using the Comprehensive Rating Index (CRI). The results showed that model performance varied considerably for daily to annual rainfall totals across the AEZs, with both overestimation and underestimation observed. For daily rainfall, EC-Earth3-Veg performed best in tropical, subtropical, and temperate AEZs; MRI-ESM2-0 performed best in the desert AEZ; and MPI-ESM1-2-LR performed best in the alpine AEZ. BCC-CSM2-MR performed well across tropical, subtropical, temperate, and alpine AEZs, while MRI-ESM2-0 performed better in desert AEZs. For annual rainfall, MRI-ESM2-0 was superior in desert and tropical AEZs, BCC-CSM2-MR performed best in temperate and alpine AEZs, and EC-Earth3-Veg performed best in the subtropical AEZ. EC-Earth3 was the least effective at reproducing mean monthly rainfall. Overall, the models’ performance was inconsistent across timescales and regions. Given the spatial and temporal variability in CMIP6 GCM performance, it is recommended that models be thoroughly evaluated and bias-corrected for specific locations and intended applications, particularly regarding their ability to simulate Ethiopia’s diverse rainfall regimes.
VL  - 11
IS  - 2
ER  -
Department of Climate Change, Ethiopia Meteorology Institute, Bahir Dar, Ethiopia
Ethiopia Meteorology Institute, Addis Ababa, Ethiopia
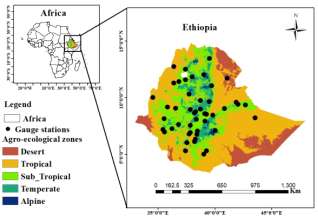
Figure 1. Location of Ethiopia in Africa and the meteorological stations used in this study.
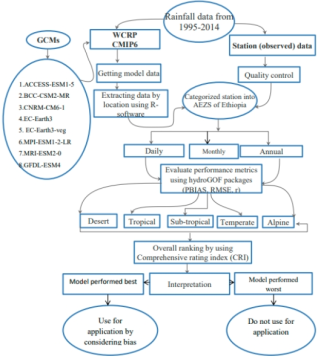
Figure 2. Research framework of the study.
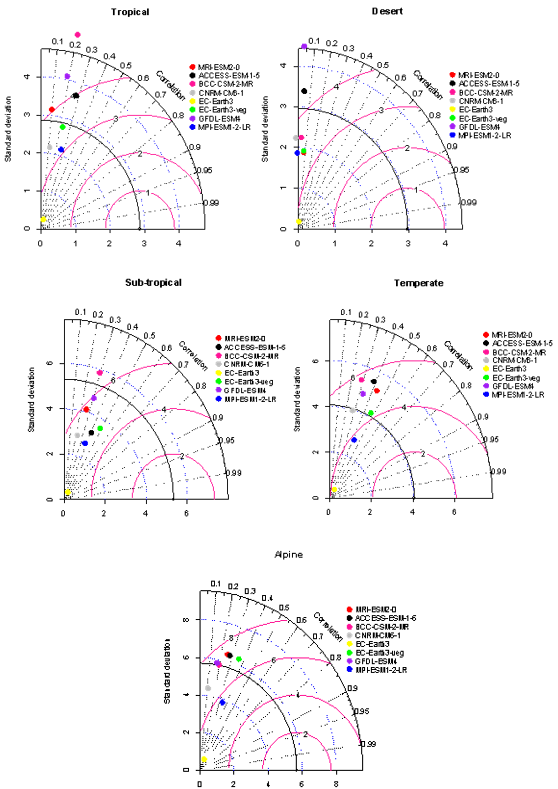
Figure 3. Taylor diagram showing the performance of CMIP6 GCMs for daily rainfall against observations across AEZs of Ethiopia (1995–2014), the black dot on the solid line represents the observed data.
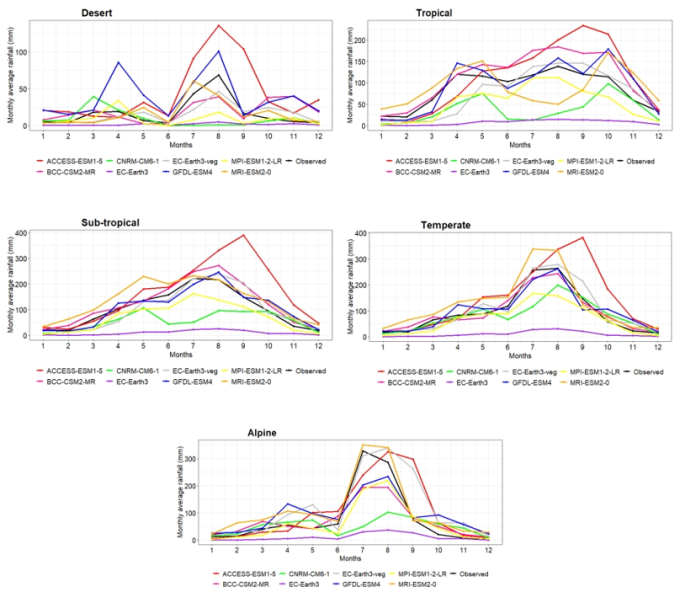
Figure 4. Line graphs comparing mean monthly observed and simulated rainfall by CMIP6 GCMs across AEZs of Ethiopia (1995–2014).
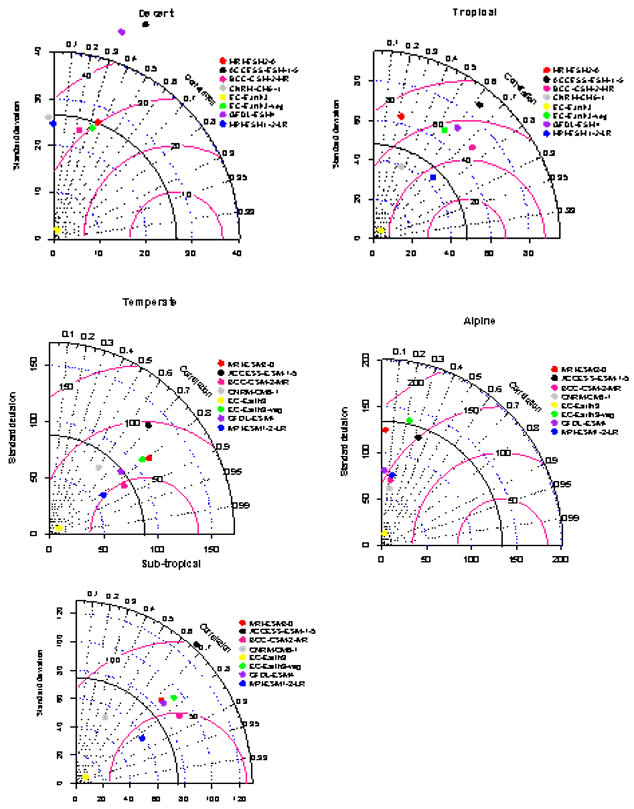
Figure 5. Taylor diagram of CMIP6 GCMs for monthly rainfall against observations across AEZs of Ethiopia (1995–2014).
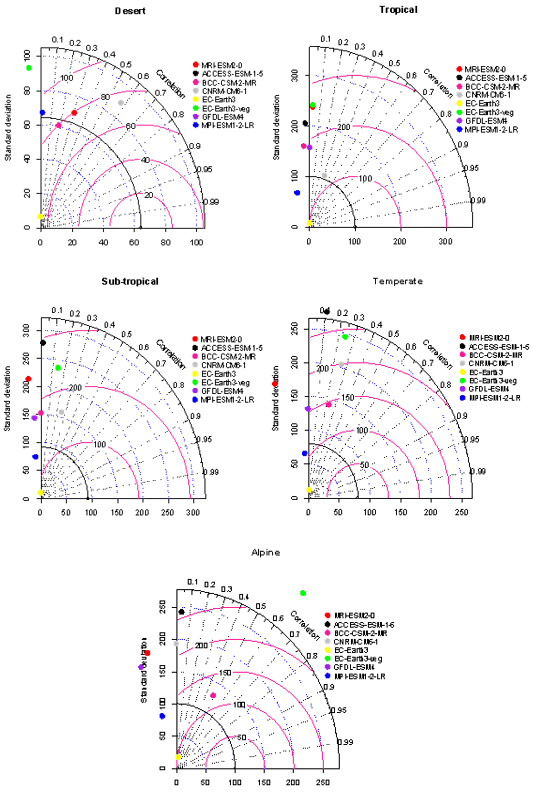
Figure 6. Taylor diagram of CMIP6 GCMs for annual rainfall against observations across AEZs of Ethiopia (1995–2014).
Information