
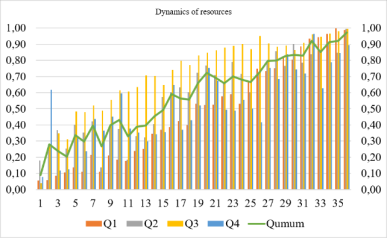
Ensuring product quality and safety in textile manufacturing depends on the coordinated management of human, material, technological, and informational resources. However, these factors are usually studied separately, and enterprises lack a single interpretable indicator for monitoring them together. The purpose of this study was to develop an integrated index model for assessing the resources that affect quality and safety at a textile enterprise and to test it on real production data. The model was applied to 36 months of monthly operational data. Twenty-seven initial indicators (X1-X27) were grouped into four resource categories: human resources, raw material and chemical resources, technical and technological resources, and information and traceability resources. From these, 18 relative indicators were derived and normalized according to whether an increase or a decrease in the indicator is favorable. Weighting coefficients were determined from expert assessments, and group indices (Q1-Q4) and an overall resource index (Qtotal), ranging from 0 to 1, were calculated for each month. The overall index rose from 0.09 in the first month to 0.97 in the final month, reflecting improvements in personnel competence, raw-material control, equipment stability, and batch traceability. Human resources and raw material and chemical resources received the highest expert weights (0.261 and 0.278, respectively). This increase should be interpreted as an improvement in the selected resource measures rather than as direct proof of improved product safety. The proposed model makes it possible to identify weak resource groups, monitor the factors affecting quality and safety, and substantiate operational, tactical, and strategic management decisions.
| Published in | International Journal of Science, Technology and Society (Volume 14, Issue 6) |
| DOI | 10.11648/j.ijsts.20261406.11 |
| Page(s) | 238-248 |
| Creative Commons |
This is an Open Access article, distributed under the terms of the Creative Commons Attribution 4.0 International License (http://creativecommons.org/licenses/by/4.0/), which permits unrestricted use, distribution and reproduction in any medium or format, provided the original work is properly cited. |
| Copyright |
Copyright © The Author(s), 2026. Published by Science Publishing Group |
Textile Enterprise, Quality Management, Product Safety, Integrated Resource Index, Expert Evaluation, Production Monitoring
Resource group | Input indicator | Derived indicator / formula | Desired direction |
|---|---|---|---|
Q1 - Human resources | X1: Total number of employees (persons) | g1 = X2/X1: Share of qualified employees (%) | Increase is positive |
Q1 - Human resources | X2: Qualified employees (persons) | g1 = X2/X1: Share of qualified employees (%) | Increase is positive |
Q1 - Human resources | X3: Average work experience (years) | g2 = X3: Average work experience (years) | Increase is positive |
Q1 - Human resources | X4: Trained employees (persons) | g3 = X4/X1: Share of trained employees (%) | Increase is positive |
Q1 - Human resources | X5: Assessment result (score) | g4 = X5: Assessment result (score) | Increase is positive |
Q1 - Human resources | X6: Compliance with discipline requirements (proportion) | g5 = X6: Compliance with discipline requirements (proportion) | Increase is positive |
Q2 - Raw material and chemical resources | X7: Total production operations (units) | g6 = X8/X7: Operator error rate (%) | Decrease is positive |
Q2 - Raw material and chemical resources | X8: Operator errors (units) | g6 = X8/X7: Operator error rate (%) | Decrease is positive |
Q2 - Raw material and chemical resources | X9: Total types of raw materials and materials (types) | g7 = X10/X9: Share of certified raw materials and materials (%) | Increase is positive |
Q2 - Raw material and chemical resources | X10: Types of raw materials and materials with certificates (types) | g7 = X10/X9: Share of certified raw materials and materials (%) | Increase is positive |
Q2 - Raw material and chemical resources | X11: Total batches (batches) | g8 = X12/X11: Share of batches that passed incoming inspection (%) | Increase is positive |
Q2 - Raw material and chemical resources | X12: Batches that passed incoming inspection (batches) | g8 = X12/X11: Share of batches that passed incoming inspection (%) | Increase is positive |
Q2 - Raw material and chemical resources | X13: Total chemical agents (items) | g9 = X14/X13: Share of agents with SDS/MSDS/TDS documentation (%) | Increase is positive |
Q2 - Raw material and chemical resources | X14: Chemical agents with SDS/MSDS/TDS documentation (items) | g9 = X14/X13: Share of agents with SDS/MSDS/TDS documentation (%) | Increase is positive |
Q2 - Raw material and chemical resources | X15: Nonconforming batches (batches) | g10 = X15/X11: Share of nonconforming batches (%) | Decrease is positive |
Q3 - Technical and technological resources | X16: Required equipment (units) | g11 = X16/X17: Share of operational equipment (%) | Increase is positive |
Q3 - Technical and technological resources | X17: Operational equipment (units) | g11 = X16/X17: Share of operational equipment (%) | Increase is positive |
Q3 - Technical and technological resources | X18: Scheduled maintenance activities (activities) | g12 = X19/X18: Share of completed maintenance activities (%) | Increase is positive |
Q3 - Technical and technological resources | X19: Completed maintenance activities (activities) | g12 = X19/X18: Share of completed maintenance activities (%) | Increase is positive |
Q3 - Technical and technological resources | X20: Inspected equipment (units) | g13 = X21/X20: Share of equipment adjusted to requirements (%) | Increase is positive |
Q3 - Technical and technological resources | X21: Equipment adjusted to requirements (units) | g13 = X21/X20: Share of equipment adjusted to requirements (%) | Increase is positive |
Q3 - Technical and technological resources | X22: Planned operating time (hours) | g14 = X23/X22: Unplanned downtime ratio (%) | Decrease is positive |
Q3 - Technical and technological resources | X23: Unplanned downtime (hours) | g14 = X23/X22: Unplanned downtime ratio (%) | Decrease is positive |
Q3 - Technical and technological resources | X24: Coded batches (batches) | g15 = X24/X11: Share of coded batches (%) | Increase is positive |
Q4 - Information resources | X25: Batches with complete documentation (batches) | g16 = X25/X11: Share of fully documented batches (%) | Increase is positive |
Q4 - Information resources | X26: Batches certified under OEKO-TEX® STANDARD 100 (batches) | g17 = X26/X11: Share of batches certified under OEKO-TEX® STANDARD 100 (%) | Increase is positive |
Q4 - Information resources | X27: Batches recorded on time (batches) | g18 = X27/X11: Share of batches recorded on time (%) | Increase is positive |
Resource factors and their initial Xn indicators over 36 months | |||||||||||||||||||||||||||
|---|---|---|---|---|---|---|---|---|---|---|---|---|---|---|---|---|---|---|---|---|---|---|---|---|---|---|---|
M | Q1 - human resources | Q2 - raw material and chemical resources | Q3 - technical and technological resources | Q4 - information and observation resources | |||||||||||||||||||||||
X1 | X2 | X3 | X4 | X5 | X6 | X7 | X8 | X9 | X10 | X11 | X12 | X13 | X14 | X15 | X16 | X17 | X18 | X19 | X20 | X21 | X22 | X23 | X24 | X25 | X26 | X27 | |
1 | 943 | 218 | 3,5 | 10 | 74 | 0,84 | 18200 | 22 | 10 | 7 | 30 | 28 | 8 | 5 | 3 | 600 | 555 | 28 | 22 | 555 | 500 | 16800 | 68 | 22 | 20 | 18 | 15 |
2 | 945 | 218 | 3,5 | 10 | 73 | 0,83 | 18750 | 20 | 10 | 7 | 28 | 27 | 8 | 5 | 3 | 600 | 558 | 30 | 23 | 558 | 556 | 16600 | 70 | 28 | 27 | 16 | 16 |
3 | 941 | 218 | 3,4 | 10 | 75 | 0,85 | 19100 | 20 | 11 | 8 | 32 | 31 | 8 | 5 | 2 | 600 | 560 | 29 | 23 | 560 | 558 | 17000 | 65 | 25 | 24 | 14 | 16 |
4 | 944 | 218 | 3,5 | 10 | 74 | 0,84 | 18600 | 18 | 11 | 8 | 32 | 30 | 9 | 6 | 3 | 600 | 560 | 31 | 24 | 560 | 558 | 16900 | 67 | 25 | 23 | 15 | 17 |
5 | 947 | 218 | 3,5 | 10 | 76 | 0,86 | 19350 | 20 | 11 | 8 | 30 | 30 | 9 | 6 | 3 | 600 | 575 | 30 | 24 | 575 | 572 | 17200 | 58 | 25 | 24 | 16 | 18 |
6 | 946 | 218 | 3,5 | 10 | 75 | 0,85 | 19000 | 20 | 12 | 9 | 32 | 31 | 9 | 6 | 3 | 600 | 575 | 32 | 25 | 575 | 572 | 17000 | 55 | 27 | 25 | 15 | 17 |
7 | 948 | 228 | 3,6 | 12 | 76 | 0,86 | 19600 | 19 | 12 | 9 | 30 | 30 | 9 | 6 | 3 | 600 | 575 | 31 | 25 | 575 | 573 | 17300 | 54 | 27 | 26 | 16 | 18 |
8 | 944 | 228 | 3,5 | 12 | 74 | 0,83 | 18850 | 20 | 12 | 9 | 31 | 28 | 10 | 7 | 4 | 600 | 580 | 30 | 23 | 580 | 578 | 16700 | 55 | 28 | 25 | 16 | 18 |
9 | 950 | 228 | 3,6 | 12 | 77 | 0,87 | 20100 | 22 | 13 | 10 | 32 | 31 | 10 | 7 | 3 | 600 | 580 | 32 | 26 | 580 | 577 | 17500 | 54 | 29 | 27 | 18 | 20 |
10 | 949 | 228 | 3,6 | 12 | 76 | 0,86 | 19750 | 22 | 13 | 10 | 30 | 29 | 10 | 7 | 3 | 600 | 590 | 31 | 25 | 590 | 587 | 17400 | 52 | 29 | 28 | 17 | 19 |
11 | 946 | 228 | 3,6 | 12 | 75 | 0,85 | 19250 | 20 | 13 | 10 | 33 | 30 | 10 | 7 | 4 | 600 | 590 | 30 | 24 | 590 | 588 | 17100 | 52 | 29 | 28 | 17 | 19 |
12 | 948 | 228 | 3,6 | 12 | 78 | 0,88 | 20300 | 22 | 13 | 10 | 34 | 32 | 10 | 7 | 3 | 600 | 590 | 32 | 26 | 590 | 586 | 17600 | 50 | 28 | 28 | 19 | 21 |
13 | 949 | 240 | 3,5 | 15 | 76 | 0,88 | 20000 | 20 | 13 | 11 | 35 | 31 | 10 | 8 | 3 | 620 | 610 | 32 | 28 | 610 | 607 | 17500 | 50 | 28 | 27 | 20 | 22 |
14 | 950 | 240 | 3,6 | 15 | 80 | 0,89 | 20450 | 20 | 14 | 12 | 34 | 31 | 11 | 9 | 3 | 620 | 610 | 33 | 29 | 610 | 605 | 17700 | 50 | 27 | 25 | 22 | 24 |
15 | 947 | 240 | 3,6 | 15 | 80 | 0,89 | 20800 | 18 | 14 | 12 | 36 | 35 | 11 | 9 | 3 | 620 | 608 | 34 | 30 | 608 | 608 | 17800 | 62 | 28 | 28 | 23 | 25 |
16 | 951 | 240 | 3,6 | 15 | 81 | 0,9 | 20300 | 18 | 14 | 12 | 32 | 31 | 11 | 9 | 2 | 650 | 640 | 33 | 30 | 640 | 635 | 17700 | 50 | 28 | 27 | 24 | 27 |
17 | 953 | 240 | 3,7 | 15 | 82 | 0,91 | 21000 | 20 | 14 | 12 | 36 | 35 | 11 | 10 | 3 | 650 | 645 | 34 | 31 | 645 | 643 | 17900 | 48 | 29 | 26 | 26 | 25 |
18 | 952 | 240 | 3,7 | 15 | 82 | 0,9 | 20700 | 21 | 15 | 13 | 38 | 37 | 12 | 10 | 3 | 660 | 655 | 35 | 31 | 655 | 652 | 17800 | 47 | 30 | 29 | 27 | 29 |
19 | 955 | 255 | 3,7 | 22 | 78 | 0,91 | 21400 | 19 | 15 | 13 | 39 | 39 | 12 | 10 | 2 | 660 | 656 | 34 | 32 | 656 | 654 | 18000 | 49 | 32 | 31 | 29 | 31 |
20 | 954 | 255 | 3,7 | 22 | 80 | 0,92 | 21000 | 17 | 15 | 13 | 35 | 35 | 12 | 11 | 2 | 660 | 656 | 35 | 33 | 656 | 656 | 18100 | 48 | 32 | 30 | 30 | 30 |
21 | 956 | 255 | 3,7 | 22 | 80 | 0,92 | 21600 | 17 | 15 | 13 | 38 | 37 | 12 | 11 | 2 | 660 | 658 | 35 | 33 | 658 | 657 | 18200 | 47 | 33 | 33 | 32 | 30 |
22 | 958 | 255 | 3,8 | 22 | 82 | 0,93 | 21300 | 18 | 16 | 14 | 39 | 37 | 13 | 12 | 2 | 660 | 658 | 36 | 34 | 658 | 658 | 18300 | 45 | 33 | 30 | 28 | 30 |
23 | 959 | 255 | 3,8 | 22 | 80 | 0,94 | 22000 | 16 | 16 | 14 | 39 | 39 | 13 | 12 | 2 | 660 | 658 | 36 | 35 | 658 | 657 | 18400 | 48 | 32 | 31 | 29 | 29 |
24 | 960 | 255 | 3,8 | 22 | 75 | 0,94 | 22350 | 16 | 16 | 15 | 40 | 38 | 13 | 12 | 2 | 660 | 658 | 36 | 35 | 658 | 655 | 18500 | 45 | 34 | 32 | 31 | 31 |
25 | 958 | 277 | 3,7 | 22 | 80 | 0,9 | 22100 | 15 | 16 | 15 | 42 | 38 | 13 | 12 | 2 | 680 | 678 | 36 | 35 | 678 | 670 | 18400 | 47 | 34 | 34 | 31 | 32 |
26 | 960 | 277 | 3,8 | 22 | 82 | 0,94 | 22550 | 13 | 16 | 15 | 42 | 40 | 13 | 12 | 2 | 680 | 678 | 36 | 36 | 678 | 675 | 18600 | 42 | 33 | 33 | 30 | 30 |
27 | 962 | 277 | 3,8 | 22 | 80 | 0,94 | 22900 | 12 | 17 | 16 | 42 | 41 | 14 | 13 | 2 | 680 | 678 | 37 | 36 | 678 | 675 | 18700 | 45 | 38 | 37 | 36 | 35 |
28 | 961 | 277 | 3,8 | 22 | 79 | 0,95 | 22600 | 10 | 17 | 16 | 42 | 42 | 14 | 13 | 2 | 680 | 677 | 37 | 37 | 677 | 673 | 18700 | 52 | 37 | 36 | 35 | 34 |
29 | 963 | 277 | 3,9 | 22 | 82 | 0,95 | 23200 | 10 | 17 | 16 | 39 | 37 | 14 | 13 | 1 | 680 | 678 | 37 | 37 | 678 | 677 | 18800 | 54 | 36 | 36 | 34 | 34 |
30 | 964 | 277 | 3,9 | 22 | 81 | 0,96 | 23000 | 11 | 17 | 16 | 42 | 42 | 14 | 13 | 1 | 680 | 678 | 38 | 37 | 678 | 677 | 18900 | 54 | 38 | 37 | 34 | 36 |
31 | 962 | 305 | 3,9 | 22 | 80 | 0,96 | 23350 | 10 | 18 | 17 | 42 | 40 | 15 | 14 | 1 | 680 | 678 | 38 | 38 | 678 | 678 | 19000 | 52 | 38 | 36 | 35 | 35 |
32 | 965 | 305 | 3,9 | 22 | 80 | 0,96 | 23600 | 10 | 18 | 17 | 39 | 38 | 15 | 14 | 1 | 700 | 698 | 38 | 38 | 698 | 696 | 19100 | 42 | 38 | 37 | 36 | 36 |
33 | 963 | 305 | 4 | 22 | 82 | 0,97 | 23450 | 11 | 18 | 17 | 43 | 42 | 15 | 14 | 1 | 700 | 698 | 39 | 38 | 698 | 697 | 19000 | 40 | 38 | 35 | 35 | 34 |
34 | 964 | 305 | 4 | 22 | 83 | 0,97 | 23800 | 10 | 18 | 17 | 42 | 42 | 15 | 14 | 1 | 700 | 698 | 39 | 39 | 698 | 697 | 19200 | 42 | 39 | 37 | 36 | 36 |
35 | 965 | 305 | 4 | 22 | 83 | 0,97 | 24100 | 9 | 18 | 17 | 42 | 41 | 15 | 14 | 1 | 700 | 698 | 39 | 39 | 698 | 698 | 19300 | 40 | 39 | 39 | 36 | 37 |
36 | 965 | 305 | 4 | 22 | 85 | 0,97 | 24300 | 10 | 18 | 18 | 40 | 40 | 15 | 15 | 1 | 700 | 698 | 40 | 40 | 698 | 697 | 19400 | 37 | 38 | 37 | 36 | 36 |
Q1 | Q2 | |||||||||
№ | g1 | g2 | g3 | g4 | g5 | g6 | g7 | g8 | g9 | g10 |
Group weight Wg | 0,178 | 0,173 | 0,162 | 0,146 | 0,168 | 0,173 | 0,254 | 0,297 | 0,246 | 0,203 |
Check | 1 | 1 | ||||||||
Q3 | Q4 | |||||||||
№ | g11 | g12 | g13 | g14 | g15 | g16 | g17 | g18 | ||
Group weight Wg | 0,242 | 0,250 | 0,258 | 0,250 | 0,242 | 0,267 | 0,233 | 0,258 | ||
Check | 1 | 1 | ||||||||
Month | Q1 | Month | Q1 |
|---|---|---|---|
1 | 0,06 | 19 | 0,53 |
2 | 0,06 | 20 | 0,52 |
3 | 0,09 | 21 | 0,53 |
4 | 0,10 | 22 | 0,58 |
5 | 0,14 | 23 | 0,59 |
6 | 0,11 | 24 | 0,53 |
7 | 0,22 | 25 | 0,66 |
8 | 0,11 | 26 | 0,75 |
9 | 0,21 | 27 | 0,73 |
10 | 0,18 | 28 | 0,75 |
11 | 0,18 | 29 | 0,82 |
12 | 0,24 | 30 | 0,81 |
13 | 0,25 | 31 | 0,89 |
14 | 0,34 | 32 | 0,93 |
15 | 0,37 | 33 | 0,94 |
16 | 0,39 | 34 | 0,96 |
17 | 0,42 | 35 | 1,00 |
18 | 0,40 | 36 | 0,99 |
Resource Group | Quality Management Department | Head of Production | Technologist | Laboratory | Warehouse Department Specialist | Digitalization, IT Department | Human Resources | Department Average score | Group Weighs Wg |
|---|---|---|---|---|---|---|---|---|---|
Human resources | 4 | 4 | 5 | 4 | 5 | 4 | 4 | 4,29 | 0,261 |
Raw materials and chemical resources | 5 | 4 | 5 | 4 | 5 | 5 | 4 | 4,57 | 0,278 |
Technical and technological resources | 4 | 4 | 4 | 4 | 4 | 4 | 5 | 4,14 | 0,252 |
Information and search resources | 3 | 3 | 4 | 3 | 4 | 3 | 4 | 3,43 | 0,209 |
Total | 16,43 | 1,000 | |||||||
Month | Q total | Month | Qtotal |
|---|---|---|---|
1 | 0,09 | 19 | 0,66 |
2 | 0,28 | 20 | 0,72 |
3 | 0,24 | 21 | 0,69 |
4 | 0,20 | 22 | 0,66 |
5 | 0,34 | 23 | 0,70 |
6 | 0,30 | 24 | 0,68 |
7 | 0,40 | 25 | 0,66 |
8 | 0,27 | 26 | 0,72 |
9 | 0,40 | 27 | 0,80 |
10 | 0,43 | 28 | 0,80 |
11 | 0,33 | 29 | 0,83 |
12 | 0,39 | 30 | 0,83 |
13 | 0,40 | 31 | 0,83 |
14 | 0,45 | 32 | 0,92 |
15 | 0,49 | 33 | 0,85 |
16 | 0,59 | 34 | 0,91 |
17 | 0,57 | 35 | 0,92 |
18 | 0,56 | 36 | 0,97 |
g1-g18 | Derived (Relative) Indicators Calculated from X1-X27 |
IT | Information Technology |
MSDS | Material Safety Data Sheet |
OEKO-TEX® STANDARD 100 | International Product-safety Certification of Textiles Tested for Harmful Substances |
Q1-Q4 | Indices of the Four Resource Groups: Human; Raw Material and Chemical; Technical and Technological; Information and Traceability |
Q_total | Total (Overall) Resource Index |
SDS | Safety Data Sheet |
TDS | Technical Data Sheet |
W_g | Weight Coefficient (of a Resource Group or of an Internal Factor) |
X1-X27 | Initial (Input) Indicators of the 36-month Database |
z | Standardized (Normalized) Value of a Derived Indicator, in the Range 0-1 |
| [1] | Aakko, M., & Niinimäki, K. (2024). Managing and negotiating: Approaches to quality work in clothing and textiles companies. Fashion Practice, 391-419. |
| [2] | Agrawal, T. K., & Pal, R. (2019). Traceability in textile and clothing supply chains: Classifying implementation factors and information sets via Delphi study. Sustainability, 11(6), Article 1698. |
| [3] | Kumar, V., Agrawal, T. K., Wang, L., & Chen, Y. (2017). Contribution of traceability towards attaining sustainability in the textile sector. Textiles and Clothing Sustainability, 3, Article 5. |
| [4] | Agrawal, T. K., Koehl, L., & Campagne, C. (2018). A secured tag for implementation of traceability in textile and clothing supply chain. The International Journal of Advanced Manufacturing Technology, 99, 2563-2577. |
| [5] | Badhwar, A., Islam, S., & Tan, C. S. L. (2023). Exploring the potential of blockchain technology within the fashion and textile supply chain with a focus on traceability, transparency, and product authenticity: A systematic review. Frontiers in Blockchain, 6, Article 1044723. |
| [6] | Ahmed, W. A. H., & MacCarthy, B. L. (2021). Blockchain-enabled supply chain traceability in the textile and apparel supply chain: A case study of the fiber producer, Lenzing. Sustainability, 13(19), Article 10496. |
| [7] | Antunes, M. G., Mucharreira, P. R., Teixeira, M. D. S., & Reis, I. A. C. (2022). ISO 9001: 2015 and risk-based thinking: Scientific research insights. Total Quality Management & Business Excellence, 33. |
| [8] | Karim, M. A., Islam, M. M., & Motamedisedeh, O. (2025). Toward sustainable performance: The role of competence and quality practices in manufacturing. Sustainability, 17(10), Article 4405. |
| [9] | Kurnia, D., Sutanto, A., & Fakhrurroja, H. (2025). AI and IoT for yarn defect detection in the textile industry: A systematic literature review. Journal of Scientific & Industrial Research, 84, 1254-1264. |
| [10] | Ozek, A., Seckin, M., Demircioglu, P., & Bogrekci, I. (2025). Artificial intelligence driving innovation in textile defect detection. Textiles, 5(2), Article 12. |
| [11] | Domskienė, J., & Gaidule, E. (2024). An overview of technological challenges in implementing the digital product passport in the textile and clothing industry. AUTEX Research Journal, 24(1), Article 20240002. |
| [12] | Carvalho, C., Silva, C. J., & Abreu, M. J. (2025). Circular economy: Literature review on the implementation of the digital product passport (DPP) in the textile industry. Sustainability, 17(5), Article 1802. |
| [13] | Libório, M. P., Karagiannis, R., Diniz, A. M. A., Ekel, P. I., Vieira, D. A. G., & Ribeiro, L. C. (2024). The use of information entropy and expert opinion in maximizing the discriminating power of composite indicators. Entropy, 26(2), Article 143. |
| [14] | Kelemen, A., Szabó, Z. K., Bozóki, S., Szádoczki, Z., & Hartvig, Á. D. (2024). A sensitivity analysis of composite indicators: Min/max thresholds. Environmental and Sustainability Indicators, 23, Article 100453. |
| [15] | Hoque, M. R., Noor, R. B., Tushar, S. R., Bappy, M. M., & Rayhan, M. G. S. (2026). Improving the overall equipment effectiveness in the textile dyeing section through total productive maintenance: Implications for economic sustainability. International Journal of Productivity and Performance Management, 1-37. |
| [16] | Kalwar, M. A., Wassan, A. N., Khan, M. A., Wadho, M. H., Shaikh, S. A., & Memon, B. A. (2025). Application of overall equipment effectiveness in increasing productivity: Case of textile company. WPOM - Working Papers on Operations Management, 16, 1-32. |
APA Style
Sotvoldieva, N., Khotam, A. (2026). Integrated Assessment Model for Quality and Safety Resources at a Textile Enterprise. International Journal of Science, Technology and Society, 14(6), 238-248. https://doi.org/10.11648/j.ijsts.20261406.11
ACS Style
Sotvoldieva, N.; Khotam, A. Integrated Assessment Model for Quality and Safety Resources at a Textile Enterprise. Int. J. Sci. Technol. Soc. 2026, 14(6), 238-248. doi: 10.11648/j.ijsts.20261406.11
@article{10.11648/j.ijsts.20261406.11,
  author = {Nasibakhon Sotvoldieva and Akbarov Khotam},
  title = {Integrated Assessment Model for Quality and Safety Resources at a Textile Enterprise},
  journal = {International Journal of Science, Technology and Society},
  volume = {14},
  number = {6},
  pages = {238-248},
  doi = {10.11648/j.ijsts.20261406.11},
  url = {https://doi.org/10.11648/j.ijsts.20261406.11},
  eprint = {https://article.sciencepublishinggroup.com/pdf/10.11648.j.ijsts.20261406.11},
  abstract = {Ensuring product quality and safety in textile manufacturing depends on the coordinated management of human, material, technological, and informational resources. However, these factors are usually studied separately, and enterprises lack a single interpretable indicator for monitoring them together. The purpose of this study was to develop an integrated index model for assessing the resources that affect quality and safety at a textile enterprise and to test it on real production data. The model was applied to 36 months of monthly operational data. Twenty-seven initial indicators (X1-X27) were grouped into four resource categories: human resources, raw material and chemical resources, technical and technological resources, and information and traceability resources. From these, 18 relative indicators were derived and normalized according to whether an increase or a decrease in the indicator is favorable. Weighting coefficients were determined from expert assessments, and group indices (Q1-Q4) and an overall resource index (Qtotal), ranging from 0 to 1, were calculated for each month. The overall index rose from 0.09 in the first month to 0.97 in the final month, reflecting improvements in personnel competence, raw-material control, equipment stability, and batch traceability. Human resources and raw material and chemical resources received the highest expert weights (0.261 and 0.278, respectively). This increase should be interpreted as an improvement in the selected resource measures rather than as direct proof of improved product safety. The proposed model makes it possible to identify weak resource groups, monitor the factors affecting quality and safety, and substantiate operational, tactical, and strategic management decisions.},
 year = {2026}
}
TY  - JOUR
T1  - Integrated Assessment Model for Quality and Safety Resources at a Textile Enterprise
AU  - Nasibakhon Sotvoldieva
AU  - Akbarov Khotam
Y1  - 2026/11/03
PY  - 2026
N1  - https://doi.org/10.11648/j.ijsts.20261406.11
DO  - 10.11648/j.ijsts.20261406.11
T2  - International Journal of Science, Technology and Society
JF  - International Journal of Science, Technology and Society
JO  - International Journal of Science, Technology and Society
SP  - 238
EP  - 248
PB  - Science Publishing Group
SN  - 2330-7420
UR  - https://doi.org/10.11648/j.ijsts.20261406.11
AB  - Ensuring product quality and safety in textile manufacturing depends on the coordinated management of human, material, technological, and informational resources. However, these factors are usually studied separately, and enterprises lack a single interpretable indicator for monitoring them together. The purpose of this study was to develop an integrated index model for assessing the resources that affect quality and safety at a textile enterprise and to test it on real production data. The model was applied to 36 months of monthly operational data. Twenty-seven initial indicators (X1-X27) were grouped into four resource categories: human resources, raw material and chemical resources, technical and technological resources, and information and traceability resources. From these, 18 relative indicators were derived and normalized according to whether an increase or a decrease in the indicator is favorable. Weighting coefficients were determined from expert assessments, and group indices (Q1-Q4) and an overall resource index (Qtotal), ranging from 0 to 1, were calculated for each month. The overall index rose from 0.09 in the first month to 0.97 in the final month, reflecting improvements in personnel competence, raw-material control, equipment stability, and batch traceability. Human resources and raw material and chemical resources received the highest expert weights (0.261 and 0.278, respectively). This increase should be interpreted as an improvement in the selected resource measures rather than as direct proof of improved product safety. The proposed model makes it possible to identify weak resource groups, monitor the factors affecting quality and safety, and substantiate operational, tactical, and strategic management decisions.
VL  - 14
IS  - 6
ER  -
Metrology and Light Industry, Andijan State Technical Institute, Andijan, Uzbekistan
Biography: Nasibakhon Sotvoldieva is a researcher at Andijan State Technical Institute, Uzbekistan. Her research interests include quality management, product quality and safety, resource management, and integrated assessment models in the textile industry. Her scientific work focuses on developing methods for evaluating resources and improving quality and safety management in textile enterprises.
Research Fields: Quality Management, Textile Industry, Product Quality and Safety, Resource Management, Integrated Assessment Models, Risk Management, Production Process Optimization, Industrial Quality Control
Department of Mechanical Engineering Technology, Andijan State Technical Institute, Andijan, Uzbekistan
Biography: Akbarov Khotam is a Candidate of Technical Sciences (PhD in Technical Sciences) and a Professor at Andijan State Technical Institute, Andijan, Uzbekistan. His research interests include textile technology, quality management, and production process optimization. He is the scientific supervisor of the first author.
Research Fields: Textile Technology, Quality Management, Product Quality and Safety, Production Process Optimization, Industrial Quality Control

Information



 Share This Article
 Twitter
 Linked In
 Facebook

 Copy
 Download