Abstract
The realization of accurate State of Health (SOH) and State of Charge (SOC) estimation is a prerequisite to ensure the safe use of energy storage batteries, which helps to further improve the energy utilization efficiency effectively. Data-driven methods are efficient, accurate, and do not rely on accurate battery models, which is a hot direction in battery state estimation research. However, the relationships between variables in the lithium-ion battery dataset are mostly nonlinear, which largely affects the prediction of the model. In addition, the model also has a series of defects, such as large computation, strong data dependence, and long consumption time. In this paper, a joint online estimation method of battery SOC-SOH based on tree modeling algorithm is proposed to solve the above problems. Based on NASA battery sample data, this study explores the changing law between SOC and discharge voltage and temperature under different State of Health (SOH). Subsequently, a combination of RFR, GBDT and XGBoost tree modeling algorithms are used for battery SOC-SOH estimation based on the above variation rules. The experimental results show that the R2 scores of the XGBoost algorithm in predicting both SOC and SOH are more than 0.995, indicating its good adaptability and feasibility.
Keywords
BMS, SOC, SOH, Tree Model
1. Introduction
New non-polluting renewable energy sources, represented by wind and solar energy, are difficult to generate electricity in a continuous and stable manner. In order to make renewable energy a completely reliable primary energy source, energy storage is a crucial factor that cannot be ignored
| [1] | Alola A A, Olanipekun I O, Shah M I. Examining the drivers of alternative energy in leading energy sustainable economies: The trilemma of energy efficiency, energy intensity and renewables expenses [J]. Renewable Energy, 2023, 202: 1190-1197. |
[1]
. With the characteristics of high energy density and high power density, lithium-ion batteries are widely used in energy storage systems. Most battery energy storage systems consist of a single unit connected in series through multiple modules to form a system. When any single unit in the battery pack reaches the voltage constraint limit, the “barrel effect” will be formed, leading to the decline of the overall capacity and power performance of the battery pack, and even an explosion
| [2] | How D N T, Hannan M A, Lipu M S H, et al. State of charge estimation for lithium-ion batteries using model-based and data-driven methods: A review [J]. Ieee Access, 2019, 7: 136116-136136. |
[2]
. The online estimation of SOC and SOH of Li-ion batteries is essential to extend the cycle life of batteries and reduce the potential risk of accidents.
Currently, there are three main methods for SOC estimation, including: time integration method, open circuit voltage method, and data driven based method. In particular, the time integration method discretized the sum of the current flowing through the battery and obtained the SOC value by simple division. The open circuit voltage method measures the open circuit voltage of the battery, and obtains the charging state according to the corresponding relationship between the open circuit voltage and the charging state. Ma et al.
| [3] | Ma Z, Yang R, Wang Z. A novel data-model fusion state-of-health estimation approach for lithium-ion batteries [J]. Applied energy, 2019, 237: 836-847. |
[3]
proposed a State of Health (SOH) estimation method based on the correlation between capacity degradation and OCV parameter changes, which takes into account the correlation between battery capacity degradation and OCV changes. Wang et al.
| [4] | Wang Q, Qi W. New SOC estimation method under multi-temperature conditions based on parametric-estimation OCV [J]. Journal of Power Electronics, 2020, 20: 614-623. |
[4]
proposed a new method for calculating model parameters and estimating State of Charge (SOC) of lithium-ion batteries based on parameter estimation of open circuit voltage (OCV) under multi-temperature conditions. Although highly accurate, the OCV method requires a long resting time to reach equilibrium in practical testing, and the resting time is affected by environmental conditions and monitoring equipment, so the method is usually used in laboratories or for calibration-assisted techniques. Comparatively, the data driven based method only needs to obtain the physical quantities measured during battery charging and discharging to extract the features, and then use these features to train the model to establish the mapping model between the battery data features and SOC. Reference
| [5] | Zhao S, Zhang C, Wang Y. Lithium-ion battery capacity and remaining useful life prediction using board learning system and long short-term memory neural network [J]. Journal of Energy Storage, 2022, 52: 104901. |
[5]
uses a generalized learning system (BLS) to process historical capacity data and generate feature nodes as an input layer to a neural network. This method also requires at least 25% of the historical capacity data, although it does not need an in-depth study of the battery aging mechanism. Reference
| [6] | Zhou W, Zheng Y, Pan Z, et al. Review on the battery model and SOC estimation method [J]. Processes, 2021, 9(9): 1685. |
[6]
constructs a random forest regression model for SOC estimation, which effectively avoids the overfitting problem and improves the estimation accuracy, and provides a reference for future research on estimation models. Due to the frequent changes in operating conditions, the energy consumption under different operating conditions varies greatly, which makes it difficult to measure the electrochemical parameters in the actual driving process of the vehicle. Reference
| [7] | Hu J, Gao Z W. A data-driven SOC prediction scheme for traction battery in electric vehicles [J]. Automotive Engineering, 2021, 43(01): 1-9. |
[7]
analyzes the energy consumption of vehicles and extracts the energy consumption factors. Based on the collected vehicle operation data, machine learning algorithms such as Lasso, Ridge, LGBoost, and XGBoost are used to train the data, and the energy consumption of temperature stratification is proposed. The model not only has high accuracy, but also achieves good prediction results.
Commonly used SOH estimation methods mainly include direct measurement method, modeling method and data driven method. The Coulomb counting method is the most direct, which completely discharges all the power after a full charge, records the current and voltage of the discharging process, and calculates its capacity by integration. This method considers that the real capacity of the battery cannot be measured precisely, and the power calculated by integration has measurement error. The open-loop voltage method
| [8] | Wen L, Bo N, Ye X, et al. A novel auto-lstm-based state of health estimation method for lithium-ion batteries [J]. Journal of Electrochemical Energy Conversion and Storage, 2021, 18(3): 030902. |
[8]
is to obtain the relationship between open-loop voltage and capacity through a large number of experiments. For on-line prediction, SOH can be obtained by directly measuring the open-loop voltage. The impedance spectrum method is to apply small amplitude currents of different frequencies to the battery to obtain the impedance of the battery, and the SOH is predicted by electrode kinetic analysis based on the impedance spectrum. The research of model-based methods focuses on identifying and analyzing the main aging mechanisms of lithium-ion batteries and estimating the battery SOH value based on the correlation between the battery SOH value and the model parameters. The commonly used models generally contain two main categories: electrochemical and equivalent circuit models. Electrochemical models. Hosseininasab S. et al. at RWTH Aachen University, Germany, proposed an estimation method based on a fractional-order battery EM model, which avoids the high computational cost due to the small number of calibration parameters while maintaining a high estimation accuracy
| [9] | Hosseininasab S, Lin C, Pischinger S, et al. State-of-health estimation of lithium-ion batteries for electrified vehicles using a reduced-order electrochemical model [J]. Journal of Energy Storage, 2022, 52: 104684. |
[9]
. An online estimation method for SOH and aging parameters based on the reduced-order electrochemical life cycle model was proposed by BiY. et al. at Auburn University, USA, which achieves the estimation of SOH and aging parameters. It was experimentally verified that the estimation errors of the proposed method were within 3% and 4% for capacity and power degradation at different temperatures, respectively
| [10] | Bi Y, Yin Y, Choe S Y. Online state of health and aging parameter estimation using a physics-based life model with a particle filter [J]. Journal of Power Sources, 2020, 476: 228655. |
[10]
. Gao Yizhao et al. proposed a SOH estimation method for Li-ion batteries based on an enhanced degradation electrochemical model and dual nonlinear filters
| [11] | Xu Z, Wang J, Lund P D, et al. Co-estimating the state of charge and health of lithium batteries through combining a minimalist electrochemical model and an equivalent circuit model [J]. Energy, 2022, 240: 122815. |
[11]
. Equivalent circuit modeling. Amirs et al. from University of Management Sciences, Lahore, Pakistan proposed a method for estimating SOH of battery based on dynamic equivalent circuit model. Compared to the 1-RC model, the proposed 2-RC model has relatively low computational complexity and outperforms the N-RC model
| [12] | Amir S, Gulzar M, Tarar M O, et al. Dynamic equivalent circuit model to estimate state-of-health of lithium-ion batteries [J]. IEEE Access, 2022, 10: 18279-18288. |
[12]
. Based on the simplified second-order RL network ECM, Yang Jufeng et al. proposed a SOH estimation method based on the decoupled dynamic characteristics of constant-current charging current. Compared with the traditional nonlinear least squares method, the dynamic decoupling method proposed in this paper has lower computational effort and higher parameter identification accuracy
| [13] | Yang J, Cai Y, Mi C C. State-of-health estimation for lithium-ion batteries based on decoupled dynamic characteristic of constant-voltage charging current [J]. IEEE Transactions on Transportation Electrification, 2021, 8(2): 2070-2079. |
[13]
. Chen Mang et al. proposed a comprehensive SOH estimation method based on multi-factor ECM, which has an estimation error of about 1% for the same battery model
| [14] | Chen M, Wu J, Jiao C, et al. Multi-Factor online estimation method for health status of lithium-ion battery [J]. Hsi-An Chiao Tung Ta Hsueh/J. Xi'an Jiaotong Univ., 2020, 54(1): 169-175. |
[14]
. Zhang et al
| [15] | Zhang Q, Wang D, Yang B, et al. Electrochemical model of lithium-ion battery for wide frequency range applications [J]. Electrochimica Acta, 2020, 343: 136094. |
[15]
analyzed the impedance characteristics by a pseudo two-dimensional (P2D) model based on the variation of battery impedance characteristics. In addition, they corrected the original model on this basis and compared it with the EIS model, which reduced the prediction error by half. Improved reliability is more favorable for SOH estimation under real operating conditions. The state of health of a battery can be estimated using a data-driven algorithm by relying only on the aging data of the battery. By virtue of superiority, data-driven algorithms are increasingly used in battery state estimation. Sarmah et al.
| [16] | Sarmah S B, Kalita P, Das B, et al. Numerical and experimental investigation of state of health of Li-ion battery [J]. International Journal of Green Energy, 2020, 17(8): 510-520. |
[16]
proposed a method combining experimental tests with numerical processing and using attenuation as an equivalent variable parameter to study the electrochemical coupling behavior of lithium-ion battery power capacity. They developed an artificial neural network structural model and validated this network model with a linear regression algorithm, which showed that the internal stress characteristics of the battery have a strong linear SOH relationship. Fan
| [17] | Fan Y, Xiao F, Li C, et al. A novel deep learning framework for state of health estimation of lithium-ion battery [J]. Journal of Energy Storage, 2020, 32: 101741. |
[17]
proposed a hybrid algorithm based on Gate Recursive Unit Convolutional Neural Network (GRU-CNN) for analyzing and studying the charging voltage profile of Li-ion batteries using an innovative modeling approach to estimate the SOH online from the measured data, such as voltage, current and temperature. In order to overcome data redundancy and improve the accuracy of the algorithm budget, he proposed an improved support vector machine algorithm based on principal component analysis (PCA)
| [18] | Song Z, Gao J, Pan L, et al. Lithium-ion battery health status prediction based on principal component analysis and improved support vector machine [J]. Automot. Technol, 2020, 11: 21-27. |
[18]
to optimize the extracted dataset to eliminate noisy bad points and redundancy, and particle swarm optimization algorithm to globally improve the support vector regression machine, which further improves the prediction accuracy of the model and the computational speed.
The above related studies are based on single-parameter estimation. However, there is a certain coupling link between SOC and SOH. For example, when estimating the SOC, the change of the maximum capacity of the battery needs to be considered, i.e., the effect of the SOH of the battery needs to be taken into account. When the battery cell is aging, the capacity and internal resistance will deviate from the nominal value, which will lead to a large SOC estimation error. At the same time, inaccurate SOC estimation will also affect the SOH correction. It can be seen that there will be some overlap in the estimation steps of these two parameters. In addition, considering the nonlinear relationship between the variables of the lithium-ion battery data set, it is difficult to use the model to establish an accurate fitting relationship between SOC and SOH on the discharge data set. Secondly, the method of SOH estimation using charge state data can not achieve online estimation. Therefore, the study of joint estimation of SOC and SOH can save some calculation steps and has high practical significance. Whether for SOC or SOH estimation, the data-driven method is very dependent on the choice of machine learning algorithm. The tree model in the machine learning algorithm has great advantages in dealing with the nonlinear relationship between features, which is just suitable for processing the charging and discharging data of energy storage batteries.
Therefore, in order to predict SOC & SOH more accurately, after analyzing the discharge data of NASA B0005 battery, this paper finds the coupling relationship between temperature, terminal voltage and SOC & SOH, and studies the prediction method based on tree model. In this study, RFR algorithm, GBDT algorithm and XGBoost algorithm are used respectively to train and test on the dataset, and the prediction result errors of different algorithms are compared. Simulation analysis shows that the XGBoost-based algorithm has better estimation stability and accuracy than other tree models. Secondly, this paper tests the running time of the algorithm, and the simulation analysis shows that although the XGBoost algorithm uses the ensemble learning method, it still has excellent computing speed in predicting SOC and SOH. Finally, the comparison with the estimation error results of other papers proves the effectiveness of the tree model algorithm.
2. Algorithm Overview
Random Forest Regression, GBDT, XGBoost mentioned in this study are integrated machine learning algorithms based on decision trees. Decision tree modeling is a popular machine learning method capable of describing the complex relationship between general input-output data and the interpretability of input features.
2.1. Decision Tree Algorithm
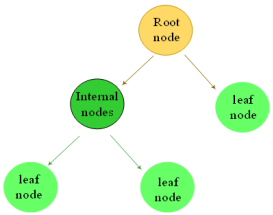
Figure 1. Schematic diagram of decision tree algorithm.
A decision tree is a nonlinear classifier that resembles the structure of a tree and consists of a root node, leaf nodes and internal nodes (non-leaf nodes). Each non-leaf node has a feature attribute on it. Based on the different values of the samples in the feature attribute, the samples on the nodes are categorized into different subsets, the structure of which is shown in
Figure 1. Each leaf node has a category tag, and each sample falling into this leaf node will be set to such category tag. When predicting, the samples start from the root node and go through a series of feature attributes to discriminate and obtain the predicted results.
The decision tree learning algorithm is a recursive process. At each step of execution, the dataset is divided into several subsets according to the feature split points, and each subset is reused as the initial dataset for the next execution. Common decision tree algorithms contain three main types: the ID3 algorithm, the C4.5 algorithm and the CART algorithm. The CART algorithm is mostly used when solving regression problems. The following is an introduction to the selection of feature segmentation points when the CART algorithm generates trees.
For the dataset

,

is the subset of samples in

belonging to the kth class and K is the number of classes. The Gini coefficient

can be expressed as:
The CART algorithm chooses the “feature-value” combination with the smallest Gini coefficient as the segmentation point. In addition, CART algorithm and C4.5 algorithm also introduce the method of discretization of continuous features, and take each value of continuous features as the segmentation point. The sample set is divided into two subsets, the sample whose value is larger than the partition point is taken as one subset, and the rest of the samples are divided into another subset. Decision trees have the advantage of being easy to understand and interpret, but are prone to overfitting. To improve these drawbacks, the random forest approach was further proposed.
2.2. Random Forest Algorithm
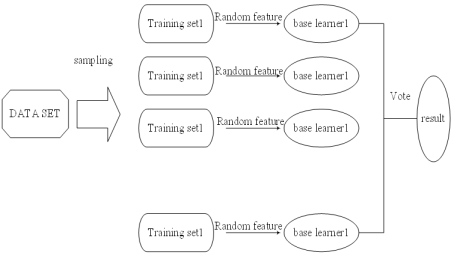
Random Forest is an upgraded algorithm of Decision Tree, which mainly introduces random feature selection on the basis of Bagging. Random feature selection is to select a feature subset randomly before each decision tree determines the segmentation point, and then select the segmentation point on this feature subset. Therefore, random forest contains two random, similar to Bagging's “random” in sample selection and “random” in feature selection. The learning framework of a random forest is shown in
Figure 2. The advantage of random forest regression is that it reduces the risk of overfitting. However, random forest algorithm performs poorly when dealing with high-dimensional sparse data, because it is difficult for random forest algorithm to find a good segmentation point when processing high-dimensional sparse data, resulting in a decline in the accuracy of the model. In contrast, GBDT and XGBoost algorithms perform better when dealing with high-dimensional sparse data and data with class imbalance, and can better handle these problems.
Figure 2. Schematic diagram of random forest structure.
Gradient Boosting Decision Tree (GBDT) is an iterative decision tree algorithm, which is a more commonly used model in Boosting algorithm. GB in GBDT, Gradient Boosting, is a large class of algorithms in Boosting. The basic idea is to train the new weak learner according to the negative gradient information of the loss function of the current model, and then combine the trained weak learner into the existing model by accumulation. Therefore, the Gradient Boosting algorithm, which uses a decision tree as a weak classifier, is called GBDT, sometimes also called Multiple Additive Regression Tree (MART) or Gradient Boosting Machine (GBM). The logic of its implementation is to build the base learners sequentially and try to reduce the bias between the learners. GBDT is based on the idea of numerical optimization, and uses the fastest descent method to solve the optimal solution of the loss function: using the regression tree to fit the negative gradient, and using Newton's method to calculate the step size. The GBDT model can avoid overfitting by reducing the bias and uses a forward distribution algorithm, which uses a decision tree, usually a CART tree. Each of them generates multiple weak learners through multiple iterations, and finally the multiple weak learners are weighted and combined.
The GBDT pays attention to the residual error of the result generated by the iteration in each round of iterative training, and the residual error of the output is continuously reduced in each round of iteration, thereby realizing that each round of iteration changes to the gradient direction in which the loss function is reduced, so that the GBDT can achieve better output effect by using less decision trees and less depth. Although GBDT has a strong operational advantage, it needs to use serial training rather than parallel training in the training process, and can only use some local parallel means within the decision tree to improve the training speed. Relatively speaking, the parallel training mode of XGBoost algorithm makes up for this shortcoming.
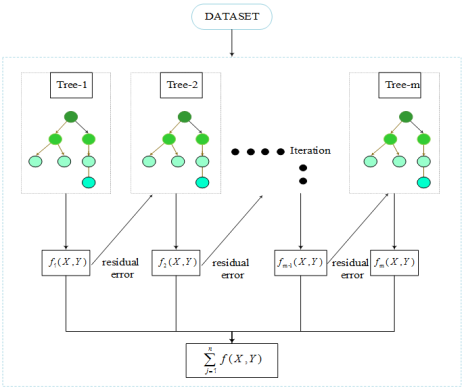
XGBoost has made a large number of optimizations on the basis of gradient boostingdecision tree (GBDT) algorithm to improve the performance and speed of the algorithm, which is one of the most representative algorithms in integrated learning. The structure of the XGBoost model is shown in
Figure 3. The XGBoost model consists of multiple decision trees, which build a tree model of decisions and possible outcomes, including the root node, internal nodes, and leaf nodes (end nodes). Each decision tree focuses on the residuals of the previous tree, branching outward from the root node and using a gradient algorithm to find a new decision tree building method to reduce the residuals of the model training, and finally the tree integration model is obtained by summation to predict the final result
| [17] | Fan Y, Xiao F, Li C, et al. A novel deep learning framework for state of health estimation of lithium-ion battery [J]. Journal of Energy Storage, 2020, 32: 101741. |
[17]
.
XGBoost not only uses the first derivative of the loss function, but also uses the information of the second derivative of the loss function, which has higher accuracy than GBDT. XGBoost adds a regularization term to the loss function to prevent overfitting. In addition, XGBoost also introduces feature subsampling similar to the use of random forests, that is, features are selected in a randomly generated feature subset, which improves the learning efficiency of the base learner. Compared with GBDT, XGBoost improves the accuracy of the algorithm and the efficiency of the implementation.
Figure 3. Schematic diagram of XGBoost algorithm structure.
In summary, Random Forest Regression, GBDT, and XGBoost are all integrated machine learning algorithms based on decision trees, which are widely used in both classification and regression problems. Decision trees are easy to understand and interpret, but are prone to overfitting; Random Forest Regression reduces the risk of overfitting, but performs poorly when dealing with high-dimensional sparse data and data with imbalanced categories; while GBDT can deal with a variety of data types, but consumes a long training time; XGBoost is fast, accurate, and scalable, but requires more computational resources.
3. Data Analysis
3.1. LI-ION Battery Capacity Degradation Data
This paper mainly uses the public battery data provided by NASA as the simulation experimental data. The battery number used in this study is B0005, the battery model is lithium iron phosphate battery, and the nominal capacity is 2Ah. The battery runs under three working conditions of charging, discharging and measuring internal resistance. The three working conditions are in the same room temperature (24℃) environment. First, charge the battery with a constant current of 1.5A until the voltage reaches 4.2V, and then charge it with a constant voltage until the current drops below 20mA. In the discharge stage, the battery is discharged at a constant current of 2A until the voltage reaches 4.2V, which is the corresponding discharge cut-off voltage. The relevant working conditions of the battery are shown in
Table 1:
Table 1. Battery charging and discharging working status.
Battery Name | Charge Cutoff Voltage(V) | Discharge Cutoff Voltage (V) | Charging Current (A) | Discharge Current (A) | Rated Capacity (Ah) |
B0005 | 4.7 | 2.7 | 1.5 | 2 | 2 |
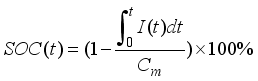
SOC is defined as the ratio between the battery's current remaining charge and its actual capacity. For practical application, it is generally calculated based on the amount of power that has been released from the battery.
Where I refers to the current, the integral of I over [0, t] indicates the amount of power discharged by the battery, and

refers to the actual capacity of the battery at the current time.
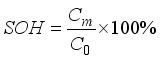
With the increase of battery usage time, its internal irreversible aging reaction will gradually intensify, externally showing the phenomenon that the actual capacity

is decreasing. Therefore, the SOH of the battery is often defined from the perspective of capacity.
Where

refers to the rated capacity of battery at factory.
According to the above relationship, the temperature-SOC and voltage-SOC curves of the lithium-ion battery are calculated and drawn using the data set, as shown in
Figure 4 and
Figure 5 below.
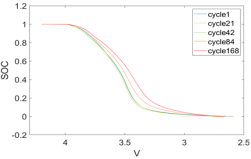
As can be seen in
Figure 4, the slope of SOC and the discharge voltage gradually decrease with the change of SOH of the battery, which indicates that the discharge voltage of the battery accelerates as the battery ages. From the figure, it can be seen that in the voltage range (3.89-3.87), the first and 84th discharge curves are closely connected, but the 168th discharge curve is very different from these two discharge curves, which indicates that the battery has experienced significant aging. In the voltage range (2.935-2.925), the first discharge curve decreases smoothly, but the 168th discharge curve decreases faster, which can also indicate that the battery has experienced significant aging when it is in the 168th discharge.
Figure 4. Voltage-SOC curve at discharge.
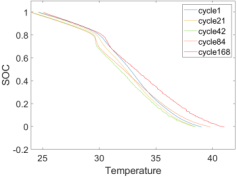
Figure 5. Temperature-SOC curve.
Figure 5 shows the relationship between SOC and temperature. The colors in the graph represent the decay of the battery. The blue color represents the first discharge and the red color on the far right represents the 168th discharge. As can be seen in the figure, the slope of SOC versus temperature decreases with the number of cycles as the cell decays. This shows that as SOH decreases, the temperature increases at a progressively slower rate.
3.3. Eigenvalue Extraction
From
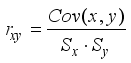
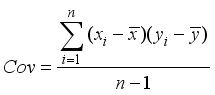
Figures 4 and 5, it can be seen that the temperature and terminal voltage affect the SOC&SOH of the battery. In order to better investigate the relationship between the SOC&SOH and the temperature and voltage, the method of calculating the person correlation coefficient is used to verify the conjecture. The formula of pearson is shown below:
where
Figure 6. Thermal map of pearson correlation.
Figure 6 is a thermal map of pearson correlation. The closer the color is to red, the higher the positive correlation, and the closer the color is to dark blue, the higher the negative correlation. By observing the thermodynamic diagram, it can be found that voltage has a positive correlation with SOC and SOH, but temperature has a great negative correlation with SOC, which shows that temperature must be one of the factors affecting SOC. SOC & SOH will be further explored around voltage and temperature below.
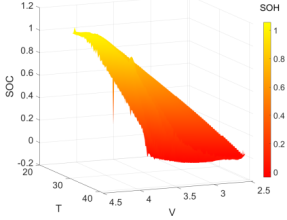
There are three factors affecting battery aging: SOC, surface temperature and discharge voltage. A defined set of SOC, discharge time, and discharge voltage corresponds to a unique SOH. The new coupling relationship between SOC and SOH is shown in
Figure 7 below:
Figure 7. T/U-SOC&SOH coupling diagram.
From
Figure 7, it can be seen that the SOH of the cell is gradually decreasing. When the color changes from yellow to deep red, the battery aging gradually deepens. A total of 168 discharge curves are plotted in the figure. Each curve represents a different battery SOH state, indicated by the color bar on the right side of the figure. In summary, the predicted expression for SOH is as follows:
However, the direct prediction of the SOH of battery by the above method will bring great computational pressure to the computer, and the storage space obtained is very limited.
Therefore, a novel SOC-SOH coupling relation is adopted in this paper to simplify the computational complexity. When determining the z-axis SOC value, it will correspond to a two-dimensional coordinate (U, T), and the above information can determine the discharged battery health curve. With this feature, the battery SOH can be predicted based on a machine learning model. The estimated expression is as follows:
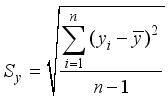
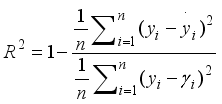
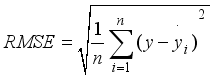
In this paper, two metrics used to characterize the prediction error, root mean square error (RMSE) and coefficient of determination (R2 score), are used to evaluate the accuracy of the ML model. The expression is as follows:
The closer the value of R2 to 1, the better the model performance. The closer the RMSE value is to 0, the better the model performance.
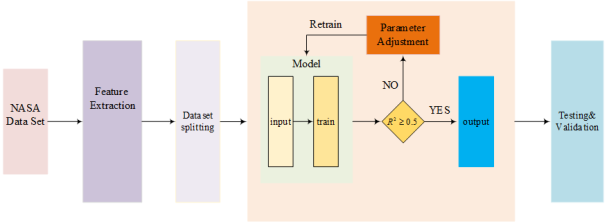
3.6. General Workflow of The Model
The general workflow of the model in this paper is shown in
Figure 8. After feature extraction, the total dataset is randomly divided into two parts, the training set and the test set, with a ratio of 4:6. After training, models with R
2 scores of 0.5 or less will be retrained. Models with R
2 scores that meet the criteria will be used to predict the full dataset for the next stage of analysis.
Figure 8. General workflow.
4. Results and Discussion
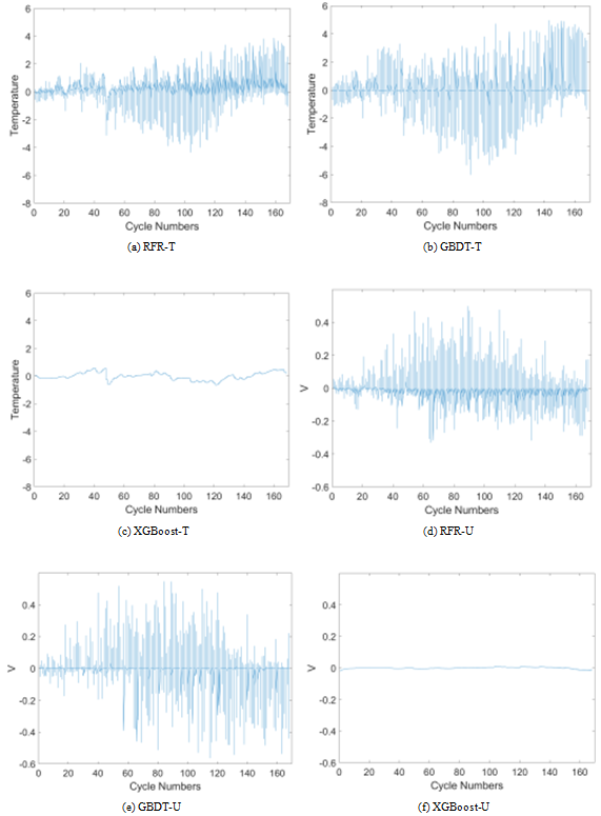
The CPU of the device used in this paper is Intel(R) Core(TM) i7-6700HQ CPU @ 2.60GHz, and all training is completed on the same device. In this paper, three methods were used to predict the voltage and temperature on the full data set, as shown in
Figure 9. The prediction error is defined by the equation
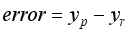
, where

refers to the predicted value and

refers to the true value. In these three graphs, the closer the curve is to

, the better the prediction. From
Figure 9(a), (b) and (c), it can be seen that for predicting temperature, the overall trend shows that Random Forest has better prediction in comparison to GBDT. From the error fluctuation ranges listed in
Table 2, it can be seen that the error fluctuation interval is 7.7 for Random Forest and 10.2 for GBDT, meanwhile, while the XGBoost error fluctuation range is well controlled within 0.75. It can be seen from
Figure 9(e), (f), and (g) that for voltage prediction, the tree model shows better performance than that for temperature prediction. At this time, the prediction errors of several methods are in the range of (-0.6, 0.5), and the error curve of XGBoost is close to

, which indicates that XGBoost can make more accurate predictions.
Table 2. The fluctuation range of prediction errors for each model
MODEL | Temperature-error | Voltage-error range |
RFR | (-4, 3.7) | (-0.32, 0.43) |
GBDT | (-6, 4.2) | (-0.58, 0.47) |
XGBoost | (-0.8, 1.1) | (-0.001, 0.003) |
Figure 9. Prediction errors of the three models on temperature and voltage.
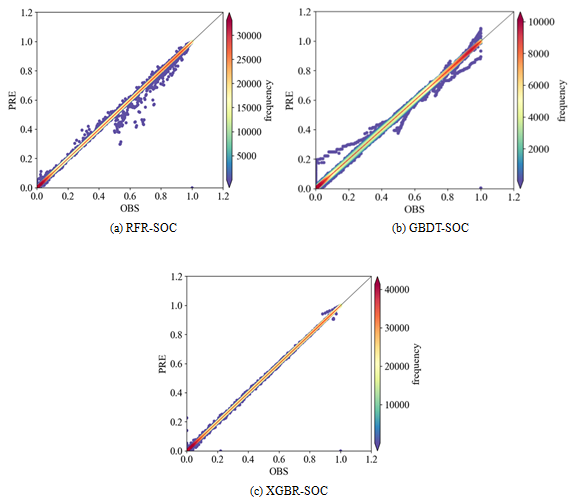
Next, this study uses three models to predict the SOC in the whole process, and the characteristics used are as follows: battery output current, load current, load voltage and time; in order to make the model have better generalization ability, the data set used for training is randomly extracted from the complete set with a probability of 0.4; finally, the SOC throughout the whole process is predicted, and the results are shown in
Figure 10.
Figure 10. Thermal plot of scatter coupling of predicted and true values of SOC.
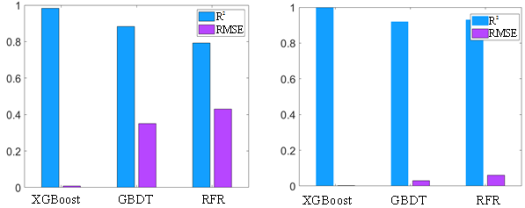
Figure 11. (a) SOC prediction model R2-RMSE; (b) SOH prediction model R2-RMSE.
Figure 10 shows the thermal plot of scatter coupling between the predicted SOC values of all data and the real SOC values produced by each model. The closer the points are to the diagonal line, the closer the predicted values are to the true values, and the redder the points are, the higher the number of points. As can be seen from the figure, the RFR method can fit the data, but there are still a large number of points outside the diagonal. Compared with RFR, the point distribution of GBDT coupling plot is more concentrated, indicating that the random forest prediction error is in a small range of fluctuation state. Combined with the R
2-RMSE histogram of the model in
Figure 10(a), it can be seen that the R
2 of XGBoost = 0.997, which is not only excellent close to 1 but also much higher than that of RFR and GBDT. The error of RFR is also at the highest level, which is in line with the prediction situation presented in
Figure 11.
Table 3 shows the RMSE of other literatures in predicting SOC. Although the performance of RFR and GBDT methods is weaker than that of the methods listed in the table, the predictive ability of XGBoost model is much better than that of the listed literature. In addition, the XGBoost model obtained after training predicts the full data running time of 0.2ms, which proves that it is fully competent for online estimation.
Figure 12. Thermal plot of scatter coupling between predicted and true values of SOH.
Figure 12 shows the thermal plot of scatter coupling between predicted and true values of SOH by the model. The plot shows that the tree models are more generalizable in predicting SOH than in predicting SOC. None of the three tree models showed large fluctuations in the plot. Combined with
Figure 11(b), it can be seen that XGBoost still performs the best, although this time the prediction of RFR is closer to the prediction ability demonstrated by GBDT, with a decrease in the RMSE of RFR.
Table 4 also shows the RMSE of other literatures in predicting SOH. At this time, the performance of RFR and GBDT methods is slightly improved. Although the error is greater than the listed literature, the model does not need complex data preprocessing in the early stage, which also proves the application value of the tree model. Meanwhile, the prediction ability of XGBoost model is higher than that of existing neural networks, and the model prediction consumes 0.07ms, which provides a strong guarantee for realizing online estimation.
Table 3. Comparison of SOC prediction results of different models with other methods.
Model | Target | RMSE (%) |
XGBoost | SOC | 0.3 |
RFR | SOC | 42 |
GBDT | SOC | 35.5 |
Deep transfer neuralnetwork + MDA 19] | SOC | 1.04 |
LSTM + UKF 0] | SOC | 0.93 |
Deep LSTM 1] | SOC | 0.76 |
Bidirectional LSTM encoder–decoder 2] | SOC | 1.07 |
Table 4. Comparison of SOH prediction results of different models with other methods
Model | Target | RMSE (%) |
XGBoost | SOH | 0.1 |
RFR | SOH | 8 |
GBDT | SOH | 5 |
(DCNN-EL) 3] | SOH | 3.539 |
Deep Neural Network (DNN) 4] | SOH | 1.59 |
LSTM+GPR 5] | SOH | 0.32 |
DNN+LSTM 6] | SOH | 98.5 |
5. Conclusions
Most data-driven methods can accurately estimate the state of the lithium battery, which can effectively reduce the risk and loss caused by failure when the power battery is used. However, the relationships between the variables of the battery data set are mostly nonlinear, which largely affects the prediction of the model. In addition, the model also has a series of defects, such as large computation, strong data dependence, and long consumption time. Considering such problems, this study proposes a joint SOC&SOH estimation method based on a tree model, which realizes the online detection and estimation of the battery management system.
First of all, this paper starts from the basic algorithm of tree modeling, and analyzes the advantages and disadvantages of different tree modeling algorithms, such as decision tree, random forest, GBDT, and XGBoost. Secondly, this paper utilizes the open data of the battery provided by NASA as the simulation experimental data, and explores the effects of temperature and voltage on SOC by plotting the temperature-SOC curve and the voltage-SOC curve, and determines that these two features can be used as the off-built features for predicting SOC by combining the analysis of the person heat map. Subsequently, the fitted surface of U&T-SOC/SOH is plotted, and the estimation formulas of SOC and SOH are established. Finally, this paper extracts some data as training sets, trains different tree models, and makes predictions on the whole data set. After comparative analysis, it is found that tree model is a more suitable machine learning model to estimate SOC&SOH. In particular, the XGBoost algorithm not only obtained R2 scores of more than 0.995 on both occasions, but also ran less than 0.2ms on the forecast full data set, demonstrating its great potential for online estimation.
The method proposed in this paper has two main advantages. (1) Compared with the traditional estimation methods that mostly can only realize offline estimation, the method proposed in this paper can realize online estimation, which further improves the timeliness of estimation. (2) The method proposed in this paper does not need to obtain the fitting coefficients of the corresponding SOC-SOH complex functional relationships, nor does it need to identify the parameters of the corresponding equivalent circuit models, etc., which further improves the generalization ability of the algorithm.
Acknowledgments
This work was supported by”Harbin manufacturing science and technology innovation talent project(2022HBRCCG006)”; “the Natural Science Foundation of Heilongjiang Province, China(LH2022E08)”and “Heilongjiang Provincial Natural Science Foundation of China (No. ZD2023B001).
Conflicts of Interest
The authors declare no conflicts of interest.
References
| [1] |
Alola A A, Olanipekun I O, Shah M I. Examining the drivers of alternative energy in leading energy sustainable economies: The trilemma of energy efficiency, energy intensity and renewables expenses [J]. Renewable Energy, 2023, 202: 1190-1197.
|
| [2] |
How D N T, Hannan M A, Lipu M S H, et al. State of charge estimation for lithium-ion batteries using model-based and data-driven methods: A review [J]. Ieee Access, 2019, 7: 136116-136136.
|
| [3] |
Ma Z, Yang R, Wang Z. A novel data-model fusion state-of-health estimation approach for lithium-ion batteries [J]. Applied energy, 2019, 237: 836-847.
|
| [4] |
Wang Q, Qi W. New SOC estimation method under multi-temperature conditions based on parametric-estimation OCV [J]. Journal of Power Electronics, 2020, 20: 614-623.
|
| [5] |
Zhao S, Zhang C, Wang Y. Lithium-ion battery capacity and remaining useful life prediction using board learning system and long short-term memory neural network [J]. Journal of Energy Storage, 2022, 52: 104901.
|
| [6] |
Zhou W, Zheng Y, Pan Z, et al. Review on the battery model and SOC estimation method [J]. Processes, 2021, 9(9): 1685.
|
| [7] |
Hu J, Gao Z W. A data-driven SOC prediction scheme for traction battery in electric vehicles [J]. Automotive Engineering, 2021, 43(01): 1-9.
|
| [8] |
Wen L, Bo N, Ye X, et al. A novel auto-lstm-based state of health estimation method for lithium-ion batteries [J]. Journal of Electrochemical Energy Conversion and Storage, 2021, 18(3): 030902.
|
| [9] |
Hosseininasab S, Lin C, Pischinger S, et al. State-of-health estimation of lithium-ion batteries for electrified vehicles using a reduced-order electrochemical model [J]. Journal of Energy Storage, 2022, 52: 104684.
|
| [10] |
Bi Y, Yin Y, Choe S Y. Online state of health and aging parameter estimation using a physics-based life model with a particle filter [J]. Journal of Power Sources, 2020, 476: 228655.
|
| [11] |
Xu Z, Wang J, Lund P D, et al. Co-estimating the state of charge and health of lithium batteries through combining a minimalist electrochemical model and an equivalent circuit model [J]. Energy, 2022, 240: 122815.
|
| [12] |
Amir S, Gulzar M, Tarar M O, et al. Dynamic equivalent circuit model to estimate state-of-health of lithium-ion batteries [J]. IEEE Access, 2022, 10: 18279-18288.
|
| [13] |
Yang J, Cai Y, Mi C C. State-of-health estimation for lithium-ion batteries based on decoupled dynamic characteristic of constant-voltage charging current [J]. IEEE Transactions on Transportation Electrification, 2021, 8(2): 2070-2079.
|
| [14] |
Chen M, Wu J, Jiao C, et al. Multi-Factor online estimation method for health status of lithium-ion battery [J]. Hsi-An Chiao Tung Ta Hsueh/J. Xi'an Jiaotong Univ., 2020, 54(1): 169-175.
|
| [15] |
Zhang Q, Wang D, Yang B, et al. Electrochemical model of lithium-ion battery for wide frequency range applications [J]. Electrochimica Acta, 2020, 343: 136094.
|
| [16] |
Sarmah S B, Kalita P, Das B, et al. Numerical and experimental investigation of state of health of Li-ion battery [J]. International Journal of Green Energy, 2020, 17(8): 510-520.
|
| [17] |
Fan Y, Xiao F, Li C, et al. A novel deep learning framework for state of health estimation of lithium-ion battery [J]. Journal of Energy Storage, 2020, 32: 101741.
|
| [18] |
Song Z, Gao J, Pan L, et al. Lithium-ion battery health status prediction based on principal component analysis and improved support vector machine [J]. Automot. Technol, 2020, 11: 21-27.
|
| [19] |
Bian C, Yang S, Miao Q. Cross-domain state-of-charge estimation of Li-ion batteries based on deep transfer neural network with multiscale distribution adaptation [J]. IEEE Transactions on Transportation Electrification, 2020, 7(3): 1260-1270.
|
| [20] |
Yang F, Zhang S, Li W, et al. State-of-charge estimation of lithium-ion batteries using LSTM and UKF [J]. Energy, 2020, 201: 117664.
|
| [21] |
Li W, Sengupta N, Dechent P, et al. Online capacity estimation of lithium-ion batteries with deep long short-term memory networks [J]. Journal of power sources, 2021, 482: 228863.
|
| [22] |
Bian C, He H, Yang S. Stacked bidirectional long short-term memory networks for state-of-charge estimation of lithium-ion batteries [J]. Energy, 2020, 191: 116538.
|
| [23] |
Shen S, Sadoughi M, Li M, et al. Deep convolutional neural networks with ensemble learning and transfer learning for capacity estimation of lithium-ion batteries [J]. Applied Energy, 2020, 260: 114296.
|
| [24] |
Cong, X., Zhang, C., Jiang, J., Zhang, W., Jiang, Y., 2020. A hybrid method for the prediction of the remaining useful life of lithium-ion batteries with accelerated capacity degradation. IEEE Trans. Veh. Technol. 69, 12775–12785.
|
| [25] |
Liu, K.; Shang, Y.; Ouyang, Q.; Widanage, W. D. A Data-driven Approach with Uncertainty Quantification for Predicting Future Capacities and Remaining Useful Life of Lithium-ion Battery. IEEE Trans. Ind. Electron. 2020, 68, 3170–3180.
|
| [26] |
Qiao, J.; Liu, X.; Chen, Z. Prediction of the Remaining Useful Life of Lithium-Ion Batteries Based on Empirical Mode Decomposition and Deep Neural Networks. IEEE Access 2020, 8, 42760–42767.
|
Cite This Article
-
APA Style
Dong, Y., Zhang, G., Li, R. (2024). Comparative Study of Joint Estimation of State of Charge (SOC) and State of Health (SOH) of Lithium-ion Batteries Based on Different Tree Models. Journal of Electrical and Electronic Engineering, 12(2), 23-35. https://doi.org/10.11648/j.jeee.20241202.11
 Copy
|
Copy
|
 Download
ACS Style
Dong, Y.; Zhang, G.; Li, R. Comparative Study of Joint Estimation of State of Charge (SOC) and State of Health (SOH) of Lithium-ion Batteries Based on Different Tree Models. J. Electr. Electron. Eng. 2024, 12(2), 23-35. doi: 10.11648/j.jeee.20241202.11
Copy
|
Download
AMA Style
Dong Y, Zhang G, Li R. Comparative Study of Joint Estimation of State of Charge (SOC) and State of Health (SOH) of Lithium-ion Batteries Based on Different Tree Models. J Electr Electron Eng. 2024;12(2):23-35. doi: 10.11648/j.jeee.20241202.11
Copy
|
Download
-
@article{10.11648/j.jeee.20241202.11,
  author = {Yuqi Dong and Guiling Zhang and Ran Li},
  title = {Comparative Study of Joint Estimation of State of Charge (SOC) and State of Health (SOH) of Lithium-ion Batteries Based on Different Tree Models
},
  journal = {Journal of Electrical and Electronic Engineering},
  volume = {12},
  number = {2},
  pages = {23-35},
  doi = {10.11648/j.jeee.20241202.11},
  url = {https://doi.org/10.11648/j.jeee.20241202.11},
  eprint = {https://article.sciencepublishinggroup.com/pdf/10.11648.j.jeee.20241202.11},
  abstract = {The realization of accurate State of Health (SOH) and State of Charge (SOC) estimation is a prerequisite to ensure the safe use of energy storage batteries, which helps to further improve the energy utilization efficiency effectively. Data-driven methods are efficient, accurate, and do not rely on accurate battery models, which is a hot direction in battery state estimation research. However, the relationships between variables in the lithium-ion battery dataset are mostly nonlinear, which largely affects the prediction of the model. In addition, the model also has a series of defects, such as large computation, strong data dependence, and long consumption time. In this paper, a joint online estimation method of battery SOC-SOH based on tree modeling algorithm is proposed to solve the above problems. Based on NASA battery sample data, this study explores the changing law between SOC and discharge voltage and temperature under different State of Health (SOH). Subsequently, a combination of RFR, GBDT and XGBoost tree modeling algorithms are used for battery SOC-SOH estimation based on the above variation rules. The experimental results show that the R2 scores of the XGBoost algorithm in predicting both SOC and SOH are more than 0.995, indicating its good adaptability and feasibility.
},
 year = {2024}
}
Copy
|
Download
-
TY  - JOUR
T1  - Comparative Study of Joint Estimation of State of Charge (SOC) and State of Health (SOH) of Lithium-ion Batteries Based on Different Tree Models

AU  - Yuqi Dong
AU  - Guiling Zhang
AU  - Ran Li
Y1  - 2024/04/29
PY  - 2024
N1  - https://doi.org/10.11648/j.jeee.20241202.11
DO  - 10.11648/j.jeee.20241202.11
T2  - Journal of Electrical and Electronic Engineering
JF  - Journal of Electrical and Electronic Engineering
JO  - Journal of Electrical and Electronic Engineering
SP  - 23
EP  - 35
PB  - Science Publishing Group
SN  - 2329-1605
UR  - https://doi.org/10.11648/j.jeee.20241202.11
AB  - The realization of accurate State of Health (SOH) and State of Charge (SOC) estimation is a prerequisite to ensure the safe use of energy storage batteries, which helps to further improve the energy utilization efficiency effectively. Data-driven methods are efficient, accurate, and do not rely on accurate battery models, which is a hot direction in battery state estimation research. However, the relationships between variables in the lithium-ion battery dataset are mostly nonlinear, which largely affects the prediction of the model. In addition, the model also has a series of defects, such as large computation, strong data dependence, and long consumption time. In this paper, a joint online estimation method of battery SOC-SOH based on tree modeling algorithm is proposed to solve the above problems. Based on NASA battery sample data, this study explores the changing law between SOC and discharge voltage and temperature under different State of Health (SOH). Subsequently, a combination of RFR, GBDT and XGBoost tree modeling algorithms are used for battery SOC-SOH estimation based on the above variation rules. The experimental results show that the R2 scores of the XGBoost algorithm in predicting both SOC and SOH are more than 0.995, indicating its good adaptability and feasibility.

VL  - 12
IS  - 2
ER  -
Copy
|
Download

 ,
,  ,
,