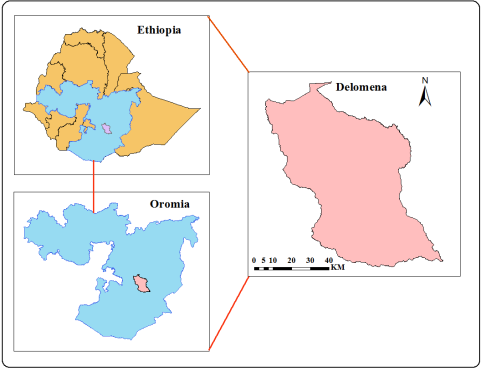
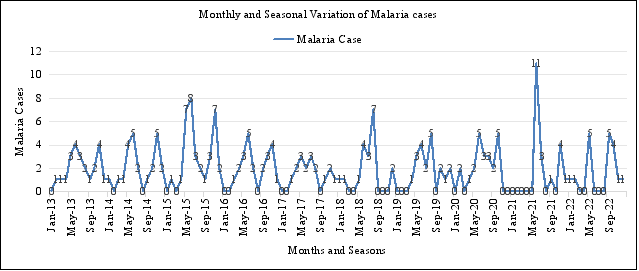
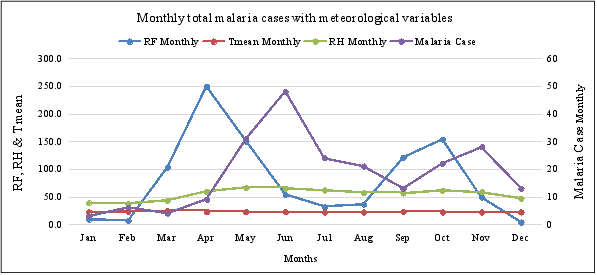
Malaria is the major public health problem in sub-Saharan Africa, including Ethiopia. Almost half of the Bale Zone's surface area is at risk for malaria. The objective of this study was to analyze the impact of climate variability on the malaria outbreak in Delomena District and recommend control and preventive measures. Meteorological variables (monthly total rainfall, average relative humidity, and mean maximum and minimum temperature) and malaria case data from 2013 to 2022 were used to analyze correlation and regression using SPSS 20v software. The results indicated that the monthly peak of malaria incidence in the Delomena district occurred in June (11 cases), 2021, a year after the main rainy season, while the lowest malaria incidence occurred in January (0 cases), following a short rainy season. Furthermore, the Spearman correlation analysis showed that monthly mean rainfall, relative humidity, and mean minimum temperature had a positive correlation with malaria occurrence but a negative correlation with mean maximum temperature. Also, the negative binomial regression model indicates that, by 1 mm and% increase, both monthly total rainfalls (0.9%) and average relative humidity (3%) at three- and two-month lagged effects were the most significant for malaria occurrence in the study area, respectively, but mean maximum temperature at zero-month lagged effect was negative. However, the mean minimum temperature has an insignificant effect on malaria incidence for all lags. The study concludes that malaria incidences in the last ten years seem to have a significant association and effect with meteorological variables. To reduce malaria outbreaks in the study area, local government and district health experts should promote early warning systems and climate-informed malaria control strategies.
| Published in | Science Discovery Health (Volume 1, Issue 1) |
| DOI | 10.11648/j.sdh.20260101.14 |
| Page(s) | 25-37 |
| Creative Commons |
This is an Open Access article, distributed under the terms of the Creative Commons Attribution 4.0 International License (http://creativecommons.org/licenses/by/4.0/), which permits unrestricted use, distribution and reproduction in any medium or format, provided the original work is properly cited. |
| Copyright |
Copyright © The Author(s), 2026. Published by Science Publishing Group |
Climate Variability, Delomena, Malaria
Malaria Case | Total RF (mm) | Ave.RH (%) | Tmax (°C) | Tmin (°C) | |
|---|---|---|---|---|---|
Malaria Case | 1.000 | ||||
Totat RF (mm) | 0.140 | 1.000 | |||
Ave.RH (%) | .480** | .403** | 1.000 | ||
Tmax (°C) | -.464** | -.323** | -.577** | 1.000 | |
Tmin (°C) | .228* | .550** | .350** | -.351** | 1.000 |
Malaria Case | Total RF (mm) | Ave.RH (%) | Tmax (°C) | Tmin (°C) | |
|---|---|---|---|---|---|
Malaria Case | 1.000 | ||||
Totat RF (mm) | .501** | 1.000 | |||
Ave.RH (%) | .469** | .392** | 1.000 | ||
Tmax (°C) | -.323** | -.318** | -.575** | 1.000 | |
Tmin (°C) | .248** | .541** | .339** | -.351** | 1.000 |
Malaria Case | Totat RF (mm) | Ave.RH (%) | Tmax (°C) | Tmin (°C) | |
|---|---|---|---|---|---|
Malaria case | 1.000 | ||||
Totat RF (mm) | .598** | 1.000 | |||
Ave.RH (%) | .379** | .350** | 1.000 | ||
Tmax (°C) | -.206* | -.257** | -.601** | 1.000 | |
Tmin (°C) | .304** | .552** | .364** | -.429** | 1.000 |
Malaria Case | TotatRF (mm) | Ave.RH (%) | Tmax (°C) | Tmin (°C) | |
|---|---|---|---|---|---|
Malaria case | 1.000 | ||||
Totat RF (mm) | .563** | 1.000 | |||
Ave.RH (%) | .257** | .318** | 1.000 | ||
Tmax (°C) | -.222* | -.350** | -.683** | 1.000 | |
Tmin (°C) | .302** | .473** | .288** | -.446** | 1.000 |
Malaria Case | Totat RF (mm) | Ave. | Tmax (°C) | Tmin (°C) | |
|---|---|---|---|---|---|
RH (%) | |||||
Malaria case | 1.000 | ||||
Totat RF (mm) | .437** | 1.000 | |||
Ave.RH (%) | 0.157 | .288** | 1.000 | ||
Tmax (°C) | 0.018 | -.217* | -.661** | 1.000 | |
Tmin (°C) | .184* | .480** | .311** | -.439** | 1.000 |
Parameter | B | Std. Error | Hypothesis Test | Exp (B) | ||
|---|---|---|---|---|---|---|
Wald Chi-Square | Df | Sig. | ||||
(Intercept) | 5.028 | 3.2044 | 2.462 | 1 | .117 | 152.573 |
TotatRF mm | -.001 | .0014 | .739 | 1 | .390 | .999 |
Ave.RH | .022 | .0114 | 3.785 | 1 | .052 | 1.022 |
Tmax°C | -.209 | .0804 | 6.760 | 1 | .009 | .811 |
Tmin°C | .035 | .0863 | .160 | 1 | .689 | 1.035 |
Parameter | B | Std. Error | Hypothesis Test | Exp (B) | ||
|---|---|---|---|---|---|---|
Wald Chi-Square | Df | Sig. | ||||
(Intercept) | 2.704 | 3.3350 | .657 | 1 | .417 | 14.942 |
Totat R.Fmm | .004 | .0013 | 7.768 | 1 | .005 | 1.004 |
Ave. RH | .026 | .0124 | 4.242 | 1 | .039 | 1.026 |
Tmax°C | -.107 | .0829 | 1.672 | 1 | .196 | .898 |
Tmin°C | -.050 | .0880 | .324 | 1 | .569 | .951 |
Parameter | B | Std. Error | Hypothesis Test | Exp (B) | ||
|---|---|---|---|---|---|---|
Wald Chi-Square | Df | Sig. | ||||
(Intercept) | -1.136 | 3.9997 | .081 | 1 | .776 | .321 |
Totat RF mm | .007 | .0018 | 14.308 | 1 | .000 | 1.007 |
Ave. RH | .029 | .0147 | 3.933 | 1 | .047 | 1.030 |
Tmax°C | .005 | .0943 | .002 | 1 | .961 | 1.005 |
Tmin°C | -.047 | .1085 | .188 | 1 | .664 | .954 |
Parameter | B | Std. Error | Hypothesis Test | Exp (B) | ||
|---|---|---|---|---|---|---|
Wald Chi-Square | Df | Sig. | ||||
(Intercept) | -3.277 | 4.4926 | .532 | 1 | .466 | .038 |
TotatRFmm | .009 | .0024 | 13.009 | 1 | .000 | 1.009 |
Ave.RH | .023 | .0157 | 2.147 | 1 | .143 | 1.023 |
Tmax°C | .081 | .1033 | .616 | 1 | .433 | 1.084 |
Tmin°C | -.042 | .1229 | .115 | 1 | .735 | .959 |
Parameter | B | Std. Error | Hypothesis Test | Exp (B) | ||
|---|---|---|---|---|---|---|
Wald Chi-Square | Df | Sig. | ||||
(Intercept) | -5.743 | 4.9414 | 1.351 | 1 | .245 | .003 |
Totat RF mm | .009 | .0031 | 9.318 | 1 | .002 | 1.009 |
Ave. RH | .026 | .0165 | 2.519 | 1 | .112 | 1.026 |
Tmax°C | .176 | .1138 | 2.380 | 1 | .123 | 1.192 |
Tmin°C | -.076 | .1332 | .324 | 1 | .569 | .927 |
EMI | Ethiopia Meteorology Institute |
GLM | General Linear Model |
SPSS | Statistical Package for Social Science |
WHO | World Health Organization |
| [1] | A. Kolahi, F. Azizi, M. Janghorbani, and H. Hatami, “Epidemiology and Control of Common Diseases in Iran,” 2011. |
| [2] | P. Venkatesan, “The 2023 WHO World malaria report,” The Lancet Microbe, vol. 5, no. 3, p. e214, 2024. |
| [3] | G. Bushi et al., “Determinants of Malaria Vaccine Acceptance: A Systematic Review and Meta-Analysis of Awareness, Acceptance, Hesitancy, and Willingness to Pay,” Immunity, Inflammation and Disease, vol. 13, no. 5, p. e70205, 2025. |
| [4] | M. Mohammadkhani, N. Khanjani, B. Bakhtiari, and K. Sheikhzadeh, “The relation between climatic factors and malaria incidence in Kerman, South East of Iran,” Parasite epidemiology and control, vol. 1, no. 3, pp. 205–210, 2016. |
| [5] | K. Paaijmans, Weather, water and malaria mosquito larvae: the impact of meteorological factors on water temperature and larvae of the Afro-tropical malaria vector Anopheles gambiae Giles. Wageningen University and Research, 2008. |
| [6] | Z. Liu et al., “Effect of temperature and its interactions with relative humidity and rainfall on malaria in a temperate city Suzhou, China,” Environmental Science and Pollution Research, vol. 28, no. 13, pp. 16830–16842, 2021. |
| [7] | N. P. Devi and R. Jauhari, “Climatic variables and malaria incidence in Dehradun, Uttaranchal, India,” Journal of vector borne diseases, vol. 43, no. 1, p. 21, 2006. |
| [8] | Y. Kim et al., “Malaria predictions based on seasonal climate forecasts in South Africa: A time series distributed lag nonlinear model,” Scientific reports, vol. 9, no. 1, p. 17882, 2019. |
| [9] | H. W. MUSINZI, “Impact of Climate Change on The Spread of Malaria Among Children Under Five Years in Vihiga County, Kenya,” 2018. |
| [10] | G. N. Bekele, “IMPACTS OF CLIMATE VARIABILITY ON THE INCIDENCE OF MALARIA AND ITS ADAPTATION STRATEGIES IN HARARI TOWN, HARARI REGIONAL STATE, EASTERN ETHIOPIA,” 2023. |
| [11] | M. C. Thomson, S. J. Connor, N. Ward, and D. Molyneux, “Impact of climate variability on infectious disease in West Africa,” EcoHealth, vol. 1, no. 2, pp. 138–150, 2004. |
| [12] | F. Huang, S. Zhou, S. Zhang, H. Wang, and L. Tang, “Temporal correlation analysis between malaria and meteorological factors in Motuo County, Tibet,” Malaria Journal, vol. 10, no. 1, p. 54, 2011. |
| [13] | T. L. Russell, N. W. Beebe, R. D. Cooper, N. F. Lobo, and T. R. Burkot, “Successful malaria elimination strategies require interventions that target changing vector behaviours,” Malaria journal, vol. 12, no. 1, p. 56, 2013. |
| [14] | E. J. Kweka, E. E. Kimaro, and S. Munga, “Effect of deforestation and land use changes on mosquito productivity and development in Western Kenya Highlands: implication for malaria risk,” Frontiers in public health, vol. 4, p. 238, 2016. |
| [15] | O. A. Babamale et al., “Association between farming activities and Plasmodium falciparum transmission in rural communities in Nigeria,” The Malaysian Journal of Medical Sciences: MJMS, vol. 27, no. 3, p. 105, 2020. |
| [16] | A. Y. Baidjoe et al., “Factors associated with high heterogeneity of malaria at fine spatial scale in the Western Kenyan highlands,” Malaria journal, vol. 15, no. 1, p. 307, 2016. |
| [17] | F. Sani Kalil, M. Hasen Bedaso, and S. Kabeta Wario, “Trends of malaria morbidity and mortality from 2010 to 2017 in Bale Zone, Ethiopia: analysis of surveillance data,” Infection and Drug Resistance, pp. 4379–4387, 2020. |
| [18] | A. Shibeshi, A. Sebsibe, A. Teka, and E. Aklilu, “Ethnobotanical study of mosquito repellent plants used in Seweyna district, Bale Zone, Southeast, Ethiopia,” Evidence-Based Complementary and Alternative Medicine, vol. 2024, no. 1, p. 6610579, 2024. |
| [19] | W. Haileselassie et al., “International border malaria transmission in the Ethiopian district of Lare, Gambella region: implications for malaria spread into South Sudan,” Malaria Journal, vol. 22, no. 1, p. 64, 2023. |
| [20] | G. J. Abiodun, R. Maharaj, P. Witbooi, and K. O. Okosun, “Modelling the influence of temperature and rainfall on the population dynamics of Anopheles arabiensis,” Malaria journal, vol. 15, no. 1, p. 364, 2016. |
| [21] | A. Minwuyelet, D. Yewhalaw, and G. Atenafu, “Retrospective analysis of malaria prevalence over ten years (2015–2024) at Bichena Primary Hospital, Amhara Region, Ethiopia,” PLoS One, vol. 20, no. 4, p. e0322570, 2025. |
| [22] | D. Nega et al., “Baseline malaria prevalence at the targeted pre-elimination districts in Ethiopia,” BMC Public Health, vol. 21, no. 1, p. 1996, 2021. |
| [23] | M. Didita, S. Nemomissa, and T. W. Gole, “Floristic and structural analysis of the woodland vegetation around Dello Menna, Southeast Ethiopia,” Journal of Forestry research, vol. 21, no. 4, pp. 395–408, 2010. |
| [24] | W. Chibssa and F. E. Flintan, “Land use change in the bale mountains eco-region of Ethiopia: Drivers, impacts and future scenarios,” 2017. |
| [25] | P. Camberlin, “Climate of eastern Africa,” Oxford research encyclopedia of climate science, 2018. |
| [26] | D. Asingizwe, M. Tuyizere, M. Mukeshimana, T. Nyandwi, C. A. Kanakuze, and E. Hakizimana, “Why becoming a positive deviant for malaria prevention and control: a sequential explanatory mixed methods study in Bugesera district, Rwanda,” Malaria Journal, vol. 23, no. 1, p. 284, 2024. |
| [27] | M. Amadi and K. H. Erandi, “Assessing the relationship between malaria incidence levels and meteorological factors using cluster-integrated regression,” BMC Infectious Diseases, vol. 24, no. 1, p. 664, 2024. |
| [28] | A. K. Githeko, S. W. Lindsay, U. E. Confalonieri, and J. A. Patz, “Climate change and vector-borne diseases: a regional analysis,” Bulletin of the world health organization, vol. 78, no. 9, pp. 1136–1147, 2000. |
| [29] | Z. S. Zhou ShuiSen et al., “Spatial correlation between malaria cases and water-bodies in Anopheles sinensis dominated areas of Huang-Huai plain, China.,” 2012. |
| [30] | T. Z. Nigussie, T. T. Zewotir, and E. K. Muluneh, “Seasonal and spatial variations of malaria transmissions in northwest Ethiopia: Evaluating climate and environmental effects using generalized additive model,” Heliyon, vol. 9, no. 4, 2023. |
| [31] | C. T. Deressa et al., “Parametrization and Analysis of Effects of Temperature and Humidity on the Development and Survival of Anopheles arabiensis strain, a major Malaria Vector in Ethiopia,” Ethiopian Journal of Education and Sciences, vol. 20, no. 2, pp. 117–136, 2025. |
| [32] | D. M. Megersa and X.-S. Luo, “Effects of Climate Change on Malaria Risk to Human Health: A Review,” Atmosphere, vol. 16, no. 1, p. 71, 2025. |
| [33] | K. Okuneye, S. E. Eikenberry, and A. B. Gumel, “Weather-driven malaria transmission model with gonotrophic and sporogonic cycles,” Journal of biological dynamics, vol. 13, no. sup 1, pp. 288–324, 2019. |
| [34] | N. THEOGENE, “Impacts of climate variability on malaria trends in Rwanda,” 2018. |
| [35] | Y. Yé, V. R. Louis, S. Simboro, and R. Sauerborn, “Effect of meteorological factors on clinical malaria risk among children: an assessment using village-based meteorological stations and community-based parasitological survey,” BMC public health, vol. 7, no. 1, p. 101, 2007 |
| [36] | K. Komen, “Could malaria control programmes be timed to coincide with onset of rainfall?,” EcoHealth, vol. 14, no. 2, pp. 259–271, 2017. |
| [37] | E. K. Kipruto et al., “Effect of climatic variability on malaria trends in Baringo County, Kenya,” Malaria journal, vol. 16, no. 1, p. 220, 2017. |
| [38] | L. F. Chaves and C. J. Koenraadt, “Climate change and highland malaria: fresh air for a hot debate,” The Quarterly review of biology, vol. 85, no. 1, pp. 27–55, 2010. |
| [39] | D. E. Ekpa, E. A. Salubi, J. A. Olusola, and D. Akintade, “Spatio-temporal analysis of environmental and climatic factors impacts on malaria morbidity in Ondo State, Nigeria,” Heliyon, vol. 9, no. 3, 2023. |
| [40] | G. An, “Influence of climate on malaria in China,” 2011. |
| [41] | H.-W. Gao et al., “Change in rainfall drives malaria re-emergence in Anhui Province, China,” 2012. |
| [42] | A. Alemu, G. Abebe, W. Tsegaye, and L. Golassa, “Climatic variables and malaria transmission dynamics in Jimma town, South West Ethiopia,” Parasites & vectors, vol. 4, no. 1, p. 30, 2011. |
| [43] | O. J. Briët, P. Vounatsou, D. M. Gunawardena, G. N. Galappaththy, and P. H. Amerasinghe, “Temporal correlation between malaria and rainfall in Sri Lanka,” Malaria journal, vol. 7, no. 1, p. 77, 2008. |
| [44] | P. Bi, S. Tong, K. Donald, K. A. Parton, and J. Ni, “Climatic variables and transmission of malaria: a 12-year data analysis in Shuchen County, China,” Public health reports, vol. 118, no. 1, p. 65, 2003. |
| [45] | T. P. Agyekum et al., “A systematic review of the effects of temperature on Anopheles mosquito development and survival: implications for malaria control in a future warmer climate,” International journal of environmental research and public health, vol. 18, no. 14, p. 7255, 2021. |
| [46] | D. Dabaro, Z. Birhanu, A. Negash, D. Hawaria, and D. Yewhalaw, “Effects of rainfall, temperature and topography on malaria incidence in elimination targeted district of Ethiopia,” Malaria journal, vol. 20, no. 1, p. 104, 2021. |
| [47] | G. M. Assefa, M. D. Muluneh, and Z. A. Alemu, “The Relationship of Climate Change and Malaria Incidence in the Gambella Region, Ethiopia,” Climate, vol. 13, no. 5, p. 104, 2025. |
| [48] | L. Sena, W. Deressa, and A. Ali, “Correlation of climate variability and malaria: a retrospective comparative study, Southwest Ethiopia,” Ethiopian journal of health sciences, vol. 25, no. 2, pp. 129–138, 2015. |
APA Style
Zegeye, M. E. (2026). Effects of Climate Variability on Malaria Outbreak in Delomenna District, Bale Zone, Ethiopia. Science Discovery Health, 1(1), 25-37. https://doi.org/10.11648/j.sdh.20260101.14
ACS Style
Zegeye, M. E. Effects of Climate Variability on Malaria Outbreak in Delomenna District, Bale Zone, Ethiopia. Sci. Discov. Health 2026, 1(1), 25-37. doi: 10.11648/j.sdh.20260101.14
@article{10.11648/j.sdh.20260101.14,
  author = {Million Ejara Zegeye},
  title = {Effects of Climate Variability on Malaria Outbreak in Delomenna District, Bale Zone, Ethiopia},
  journal = {Science Discovery Health},
  volume = {1},
  number = {1},
  pages = {25-37},
  doi = {10.11648/j.sdh.20260101.14},
  url = {https://doi.org/10.11648/j.sdh.20260101.14},
  eprint = {https://article.sciencepublishinggroup.com/pdf/10.11648.j.sdh.20260101.14},
  abstract = {Malaria is the major public health problem in sub-Saharan Africa, including Ethiopia. Almost half of the Bale Zone's surface area is at risk for malaria. The objective of this study was to analyze the impact of climate variability on the malaria outbreak in Delomena District and recommend control and preventive measures. Meteorological variables (monthly total rainfall, average relative humidity, and mean maximum and minimum temperature) and malaria case data from 2013 to 2022 were used to analyze correlation and regression using SPSS 20v software. The results indicated that the monthly peak of malaria incidence in the Delomena district occurred in June (11 cases), 2021, a year after the main rainy season, while the lowest malaria incidence occurred in January (0 cases), following a short rainy season. Furthermore, the Spearman correlation analysis showed that monthly mean rainfall, relative humidity, and mean minimum temperature had a positive correlation with malaria occurrence but a negative correlation with mean maximum temperature. Also, the negative binomial regression model indicates that, by 1 mm and% increase, both monthly total rainfalls (0.9%) and average relative humidity (3%) at three- and two-month lagged effects were the most significant for malaria occurrence in the study area, respectively, but mean maximum temperature at zero-month lagged effect was negative. However, the mean minimum temperature has an insignificant effect on malaria incidence for all lags. The study concludes that malaria incidences in the last ten years seem to have a significant association and effect with meteorological variables. To reduce malaria outbreaks in the study area, local government and district health experts should promote early warning systems and climate-informed malaria control strategies.},
 year = {2026}
}
TY  - JOUR
T1  - Effects of Climate Variability on Malaria Outbreak in Delomenna District, Bale Zone, Ethiopia
AU  - Million Ejara Zegeye
Y1  - 2026/03/09
PY  - 2026
N1  - https://doi.org/10.11648/j.sdh.20260101.14
DO  - 10.11648/j.sdh.20260101.14
T2  - Science Discovery Health
JF  - Science Discovery Health
JO  - Science Discovery Health
SP  - 25
EP  - 37
PB  - Science Publishing Group
UR  - https://doi.org/10.11648/j.sdh.20260101.14
AB  - Malaria is the major public health problem in sub-Saharan Africa, including Ethiopia. Almost half of the Bale Zone's surface area is at risk for malaria. The objective of this study was to analyze the impact of climate variability on the malaria outbreak in Delomena District and recommend control and preventive measures. Meteorological variables (monthly total rainfall, average relative humidity, and mean maximum and minimum temperature) and malaria case data from 2013 to 2022 were used to analyze correlation and regression using SPSS 20v software. The results indicated that the monthly peak of malaria incidence in the Delomena district occurred in June (11 cases), 2021, a year after the main rainy season, while the lowest malaria incidence occurred in January (0 cases), following a short rainy season. Furthermore, the Spearman correlation analysis showed that monthly mean rainfall, relative humidity, and mean minimum temperature had a positive correlation with malaria occurrence but a negative correlation with mean maximum temperature. Also, the negative binomial regression model indicates that, by 1 mm and% increase, both monthly total rainfalls (0.9%) and average relative humidity (3%) at three- and two-month lagged effects were the most significant for malaria occurrence in the study area, respectively, but mean maximum temperature at zero-month lagged effect was negative. However, the mean minimum temperature has an insignificant effect on malaria incidence for all lags. The study concludes that malaria incidences in the last ten years seem to have a significant association and effect with meteorological variables. To reduce malaria outbreaks in the study area, local government and district health experts should promote early warning systems and climate-informed malaria control strategies.
VL  - 1
IS  - 1
ER  -
Southern Oromia Meteorological Service Research Center, Ethiopia Meteorology Institute, Robe, Ethiopia
Information