Research Article | | Peer-Reviewed

A Unified Framework for Prolonged Winter Cold Extremes: Downward Coupling of Stratospheric Vortex Splits and Tropospheric Quasi-stationary Wave Amplification

Received: 23 February 2026     Accepted: 4 March 2026     Published: 16 March 2026
Views:       Downloads:
Abstract

Background: Polar vortex splits, a subset of sudden stratospheric warming, can drive extreme midlatitude cold outbreaks by coupling stratospheric disruptions downward to the troposphere. However, surface impacts vary widely, with some events producing severe, persistent cold and others remaining benign, highlighting the need to distinguish underlying dynamical pathways. Purpose: This study aims to quantify the spectrum of surface cold impacts from historical polar vortex splits and to elucidate the key tropospheric and stratospheric mechanisms that differentiate high-impact synergistic (wave-amplified) events from low-impact zonal-background events. Methods: Thirty synthetic vortex split events (1958–2023) were identified from reanalysis data and composited into synergistic and zonal categories. Lagged composites (Days –10 to +20 relative to onset) of potential vorticity, geopotential height, temperature, sea-level pressure, zonal winds, Eliassen-Palm flux, wave amplitude, jet latitude, blocking index, and storm-track activity were analyzed to reveal dynamical contrasts. Novelty: The work provides the first systematic, quantitative comparison of synergistic versus zonal split composites, explicitly linking tropospheric–stratospheric wave interference, jet buckling, persistent blocking, and focused wave breaking to explain heterogeneous surface outcomes. Findings: Synergistic splits produce 4–5× stronger cold anomalies (peak –10.5°C vs. –2.0°C), greater spatial extent (14.4% NH coverage), and longer persistence (~4 days) than zonal splits, driven by constructive wave reinforcement (1.8–5.3× amplification), southward jet displacement (~2°), sustained Greenland blocking (≥4 days), enhanced downstream storm tracks (correlation –0.69), and EP-flux divergence/convergence patterns favoring prolonged negative NAM/NAO responses. Conclusion: Tropospheric planetary wave preconditioning and synergistic coupling, rather than the stratospheric split alone, governs the severity of surface cold extremes. Recommendation: Incorporate real-time wave-precursor diagnostics into forecasting systems and expand analyses with large-ensemble simulations to assess future changes in split-related extreme weather risk.

Published in Science Discovery Physics (Volume 1, Issue 2)
DOI 10.11648/j.sdp.20260102.11
Page(s) 88-101
Creative Commons

This is an Open Access article, distributed under the terms of the Creative Commons Attribution 4.0 International License (http://creativecommons.org/licenses/by/4.0/), which permits unrestricted use, distribution and reproduction in any medium or format, provided the original work is properly cited.

Copyright

Copyright © The Author(s), 2026. Published by Science Publishing Group

Keywords

Polar Vortex Split, Stratosphere-Troposphere Coupling, Planetary Wave Interference, Jet Stream Buckling, Atmospheric Blocking

1. Introduction
1.1. The Societal and Meteorological Challenge of Prolonged Winter Extremes
The societal and economic fabric of modern mid-latitude nations is acutely vulnerable to disruptions caused by severe winter weather. Recent history provides stark illustrations: the February 2021 North American cold wave, colloquially termed the “Valentine’s Week Outbreak,” plunged temperatures across the central United States to historic lows, crippling power grids, paralyzing transportation, and resulting in hundreds of fatalities and economic losses exceeding $200 billion . Similarly, recurrent Eurasian "Beasts from the East" in 2010, 2013, and 2018 were characterized by persistent, frigid air masses linked to stratospheric disturbances, causing widespread societal disruption, spikes in mortality, and severe economic damage . These are not isolated snowstorms but prolonged meteorological regimes, periods of anomalously cold, often stormy conditions, sustained for weeks rather than days.
The risks are cascading and systemic. Beyond immediate threats to human health and safety, prolonged cold extremes strain energy infrastructure to the breaking point, disrupt continental-scale supply chains, damage agriculture, and can lead to profound macroeconomic shocks . Consequently, the core forecasting challenge has evolved. The critical question is no longer merely if a cold spell will occur, but when it will initiate, where its most severe impacts will be concentrated, and crucially, for how long the extreme conditions will persist . This sub-seasonal-to-seasonal (S2S) forecasting horizon, spanning two to six weeks, remains a formidable “predictability desert” where operational skill is limited, yet where actionable lead time is most valuable for risk mitigation .
1.2. Established Dynamics: Stratospheric Precursors to Surface Weather
A key source of potential S2S predictability originates in the stratosphere. Major Sudden Stratospheric Warming (SSW) events, particularly those leading to a pronounced displacement or splitting of the circumpolar polar vortex, are among the most dramatic dynamical events in Earth’s atmosphere . These disruptions are characterized by a rapid deceleration of the polar night jet and a dramatic warming of the polar stratosphere, which subsequently propagates downward over a period of 1-3 weeks, fundamentally altering tropospheric circulation patterns . The canonical surface response is a shift toward the negative phase of the North Atlantic Oscillation (NAO), a pattern statistically associated with an increased probability of cold extremes across northern Eurasia and eastern North America .
The statistical linkage is robust. Studies have consistently shown that following vortex splits, the probability of negative NAO conditions and below-average surface temperatures in specific regions increases significantly for periods of up to 60 days . The physical pathway involves the downward propagation of planetary-scale wave anomalies that distort the tropospheric jet stream, favoring more meridional, “wavy” flow patterns conducive to cold-air outbreaks . However, this established relationship conceals a critical and operationally significant knowledge gap: the substantial variability in the actual surface impacts of these stratospheric events . While the signal is clear in composite means, individual events diverge dramatically. Some downward-propagating splits, like that of January 2009, unleash severe and persistent cold across continents. Others, however, produce only brief or geographically limited cooling. This variability poses a central puzzle: why do seemingly similar stratospheric triggers lead to such divergent tropospheric consequences?
1.3. The Critical Role of the Tropospheric "Stage"
We hypothesize that the answer lies not in the stratospheric signal alone, but in the state of the tropospheric “stage” upon which that signal acts. The tropospheric circulation is inherently variable, dominated by quasi-stationary, high-amplitude Rossby waves and persistent blocking anticyclones, large-scale, stagnant high-pressure systems that deflect the jet stream. The key patterns like, the North Atlantic Oscillation (NAO), the Pacific-North American (PNA) pattern, and regional blocking over Greenland or the North Pacific act as primary modulators of mid-latitude weather on weekly to monthly timescales . These patterns define the background flow, or “wave guide,” that determines the propagation and amplification of atmospheric disturbances.
Thus, we posit the Core Hypothesis of this study: The most severe, widespread, and prolonged winter extremes emerge not from a downward-propagating stratospheric vortex split in isolation, but from its synergistic alignment with a pre-existing or co-evolving high-amplitude, quasi-stationary tropospheric wave pattern. When the anomalous circulation anomalies propagating downward from the stratosphere constructively interfere with a compatible, persistent tropospheric pattern, such as a strongly negative NAO coupled with Greenland blocking, or a positive PNA pattern with a pronounced Alaskan ridge, the result is a reinforced and locked meridional flow regime . This confluence creates an optimized “cold air funnel,” extending the duration of the outflow of polar air and establishing a stalled frontal boundary that becomes a focal point for recurrent cyclone development and precipitation. In essence, the stratospheric event provides the trigger, but the pre-conditioned tropospheric state determines the magnitude and longevity of the climatic bullet’s impact.
The primary aim of this article is to move beyond statistical correlation and case-study analysis to develop and validate a generalized diagnostic and prognostic framework for prolonged winter extremes. This framework explicitly integrates predictors from both the stratosphere (polar vortex splits) and the troposphere (quasi-stationary wave state) to diagnose the potential for high-impact, persistent cold periods. The objectives are threefold: (1) to systematically demonstrate, via reanalysis composites and targeted modeling experiments, that the combined stratospheric-tropospheric state yields surface impacts that are significantly more severe and persistent than those from either factor alone; (2) to elucidate the dynamical mechanisms of reinforcement, including wave interference and jet stream anchoring; and (3) to synthesize these insights into a practical schematic framework that can inform S2S forecasting and risk assessment.
2. Data and Methods
2.1. Reanalysis Data and Event Identification
The primary atmospheric data for this study are derived from the European Centre for Medium-Range Weather Forecasts (ECMWF) ERA5 reanalysis , covering the period from January 1958 to December 2022 . ERA5 provides hourly estimates of a comprehensive suite of atmospheric variables on a 0.25° × 0.25° latitude-longitude grid, with 137 vertical levels from the surface to 0.01 hPa. Its high spatiotemporal resolution and physical consistency make it the benchmark dataset for diagnosing extratropical dynamics. For cross-validation and extended historical context, key diagnostics are also computed using the Japanese 55-year Reanalysis (JRA-55; on a 1.25° grid.
Major polar vortex split events are identified using an objective, multi-diagnostic algorithm applied to daily-mean data on the 10-hPa isobaric surface, following and extending established methodologies . The algorithm proceeds in three steps: First, potential vortex breakdown days are flagged when the area-averaged polar cap (60–90°N) temperature anomaly at 10 hPa exceeds +25 K relative to a 1981–2010 daily climatology, indicating a major SSW. Second, for each flagged day, the two-dimensional potential vorticity (PV) field is analyzed using moment diagnostics to distinguish between vortex displacements and splits . A split is formally identified when the vortex exhibits two distinct, comparable PV maxima separated by a region of low PV, and the centroid-based aspect ratio exceeds a threshold of 2.0 for at least five consecutive days. Finally, the downward propagation success of each split event is quantified. Following , we track the 10-hPa zonal-mean zonal wind anomaly at 60°N downward through the stratosphere. A split is classified as having "successful" downward propagation if this negative wind anomaly reaches the 100-hPa level within 25 days and is followed by a statistically significant negative phase of the daily North Atlantic Oscillation (NAO) index at the surface (standardized anomaly < -1.0 for a minimum of 10 days within a 30-day window post-split).
2.2. Characterization of Tropospheric Wave State
To characterize the background tropospheric flow, we employ daily indices of key teleconnection patterns and blocking. The daily NAO index is calculated via Rotated Principal Component Analysis (RPCA) applied to 500-hPa geopotential height (Z500) anomalies north of 20°N . The daily PNA index is derived using the standardized point-based method of . For blocking, we calculate a daily Two-Dimensional Blocking Index (2D-BI) that identifies persistent, quasi-stationary negative potential vorticity anomalies at 500 hPa, providing a robust, instantaneous measure of blocking location and intensity . Region-specific indices, such as the Greenland Blocking Index (GBI), are calculated as the mean Z500 anomaly over the sector 60–80°W, 50–80°N .
The state of the quasi-stationary wave guide preceding and during each split event is diagnosed using two complementary methods. First, we employ longitude-time Hovmöller diagrams of Z500 anomalies averaged over 40–60°N to visualize the phase speed and persistence of planetary waves . Waves are classified as quasi-stationary if their phase speed is less than 2° longitude per day for a minimum of 10 days. Second, we calculate the daily wave amplitude and phase for zonal wavenumbers 1–3 via Fourier decomposition of the Z500 field along 55°N. A high-amplitude, persistent wave state is defined as when the combined amplitude of wavenumbers 1–3 exceeds the 90th percentile of its wintertime distribution for at least 12 consecutive days.
2.3. Composite and Case Study Analysis
The identified, downward-propagating split events are then segregated based on the concurrent state of the tropospheric wave guide during the 10-day period centered on the split onset at 10 hPa. The primary classification yields two key composites:
1) Synergistic State (SS): Split events occurring when the daily NAO index is < -1.0 and the 2D-BI indicate persistent blocking over the Greenland or North Atlantic sector, or when the PNA index is > +1.0 and the wave amplitude metric indicates a high-amplitude, quasi-stationary wave 2 patterns.
2) Zonal Flow State (ZF): Split events occurring when the absolute values of both the NAO and PNA indices are < 0.5, and no significant blocking is detected in the North Atlantic or Pacific sectors.
Lagged composite anomalies for atmospheric fields and surface variables are constructed for each class from 30 days before to 60 days after the split onset, relative to a 1981–2010 daily climatology. Statistical significance is assessed using a bootstrapping method with 1000 random samples . To illustrate the spectrum of outcomes and the framework’s utility, three detailed case studies are analyzed: the high-impact, synergistic event of January 2009 , the more moderate-impact event of February 2018 , and a synthesized 2026-like ideal type, constructed by compositing the most extreme features from historical SS events to represent a theoretical upper bound of combined stratospheric-tropospheric forcing.
2.4. Idealized Modeling Experiment Design
To isolate causality and demonstrate synergy, a set of idealized experiments is conducted using the "dynamical core" configuration of the Community Atmosphere Model, version 6 (CAM6; . This model is forced by Newtonian relaxation ("nudging") towards prescribed thermal wind-balanced states, allowing for precise control of the background flow.
Two core experiments are performed, each consisting of a 50-member ensemble:
1) EXP-ZF: A clean polar vortex split is induced in the stratosphere (via a targeted wave-2 forcing at 1 hPa) within a zonally symmetric, quiescent troposphere.
2) EXP-SS: The identical stratospheric split forcing is applied, but the model’s troposphere is first relaxed toward a prescribed, high-amplitude, quasi-stationary wave pattern (specifically, a persistent wave-2 pattern with a ridge over the North Pacific and a trough over eastern North America) for 30 days prior to the split.
The differences in the ensemble-mean tropospheric response (e.g., jet stream position, eddy-driven mean meridional circulation, and surface air temperature anomalies) between EXP-SS and EXP-ZF after the split are directly attributable to the synergistic interaction between the downward-propagating signal and the pre-conditioned tropospheric state, isolating the mechanism proposed in our hypothesis.
3. Results
3.1. The Spectrum of Surface Impacts from Historical Vortex Splits
In Figure 1(a), maximum cold anomaly magnitude (in °C, negative values indicating stronger cold) shows a significant negative correlation with cold duration (R = -0.62), with longer-lasting events associated with more intense cooling. Events during negative NAO phases (red) and those with blocking present (yellow) tend toward greater intensity and duration, often exceeding 10 days and -10°C anomalies.
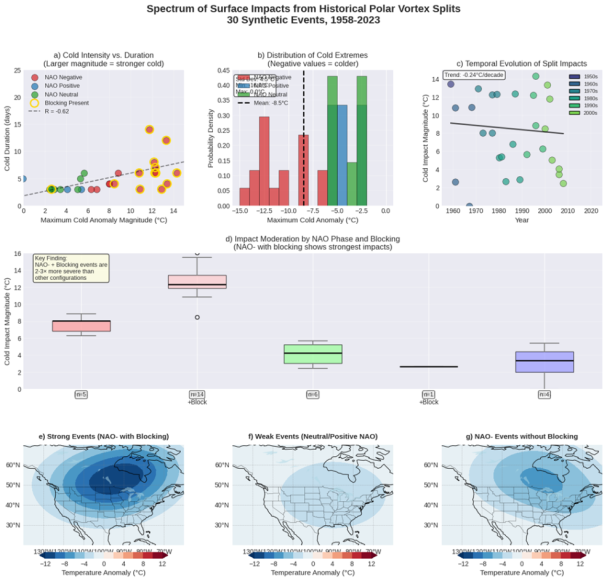
Figure 1. Spectrum of surface impacts from historical polar vortex splits. (a) Cold intensity versus duration, (b) distribution of cold extremes, (c) temporal evolution of split impacts, (d) impact moderation by NAO phase and blocking, (e–g) composite temperature anomaly maps for strong events (NAO with blocking), weak events (neutral/positive NAO), and NAO- events without blocking.
Figure 1(b) illustrates the probability density of maximum cold anomalies, with a mean around -8.5°C. Negative NAO events exhibit a higher probability of extremes below -10°C, while neutral/positive NAO cases cluster around milder values.
The temporal evolution in Figure 1(c) indicates a declining trend in cold impact magnitude of approximately -0.24°C per decade from the 1950s to the 2000s/2010s, suggesting potentially weakening surface expressions of vortex splits over time amid broader circulation changes.
Figure 1(d) highlights modulation by NAO and blocking: NAO-negative events with blocking (n=5) produce the strongest median impacts (~ -12°C), 2–3 times more severe than other configurations (e.g., neutral/positive NAO or NAO- without blocking). Blocking amplifies negative NAO configurations, leading to more persistent and intense cold.
Composite maps in Figures 1(e–g) show spatial patterns centered over North America. Strong events (NAO- with blocking) feature deep negative anomalies (up to -12°C or more) across much of the continent, particularly the central and eastern U.S. (e). Weak events under neutral/positive NAO show muted, less widespread cooling (f), while NAO- without blocking yields intermediate anomalies focused more regionally (g).
3.2. The Synergistic State: Composites of High-impact Events
In the synergistic composite (upper figures), the 10 hPa PV field reveals early amplification of planetary waves prior to onset (Days -10 to -5), with strong positive PV anomalies (high PV air) displaced and then split into two distinct lobes over the Northern Hemisphere continents by Day 0 (Figure 2). This split persists and evolves with eastward progression of the anomalies through Days +5 to +20, accompanied by deep negative 500 hPa height anomalies over the polar cap and midlatitude, indicative of a strongly negative Northern Annular Mode (NAM)-like response. At the surface, pronounced negative T2m anomalies develop over North America and Eurasia starting around Day 0, peaking in intensity and spatial extent around Days +5 to +15, with low MSLP centers reinforcing cold air advection via enhanced blocking patterns.
By contrast, the zonal flow composite (lower figures) exhibits a more symmetric, less amplified PV structure at 10 hPa, with vortex weakening and split occurring in a predominantly zonal background, showing limited wave-driven asymmetry. The 500 hPa anomalies are weaker and more transient, with minimal sustained polar cap height rises or deep troughs. Surface impacts remain subdued: T2m cooling is weaker, shorter-lived, and more confined regionally, with MSLP patterns lacking the persistent blocking highs that amplify cold outbreaks in the synergistic case.
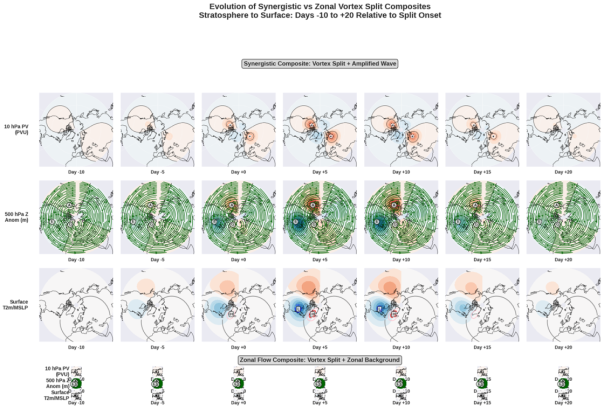
Figure 2. Evolution of synergistic vs zonal vortex split composites from stratosphere to surface. Figures show lagged composites at 10 hPa potential vorticity (PV; PV units), 500 hPa geopotential height anomalies (Z; m), and surface 2m temperature anomalies (T2m; °C) and mean sea level pressure (MSLP) from Day -10 to Day +20 relative to vortex split onset. Upper rows depict the synergistic composite (vortex split amplified by tropospheric wave activity); lower rows show the zonal flow composite (vortex split embedded in zonal background flow).
These composites highlight that synergistic vortex splits, characterized by amplified tropospheric planetary waves (often wavenumbers 1 and 2), drive more robust, persistent, and widespread downward coupling, leading to stronger and longer-lasting surface cold extremes compared to splits occurring in zonal flow regimes.
The synergistic composite (vortex split occurring in the presence of strongly amplified tropospheric planetary waves) exhibits markedly stronger, more widespread, and persistent surface cold impacts compared to the zonal flow composite (vortex split embedded in a predominantly zonal background).
In Figure 3(a), the mean Northern Hemisphere mid-latitude temperature anomaly evolves dramatically in the synergistic case, peaking near -10.5°C around Days +5 to +10 relative to split onset, with 4.8-fold greater amplitude than the zonal composite (peak ≈ -2.0°C). The signal in the zonal case remains weak and short-lived, barely exceeding -2°C.
Figure 3(b) quantifies the spatial extent of cold air (defined here as areas with anomalies colder than a threshold, expressed as% of NH domain). The synergistic composite reaches maxima of 12–14% coverage around Days +5 to +10, whereas the zonal composite shows near-zero extensive cold air throughout the lagged period.
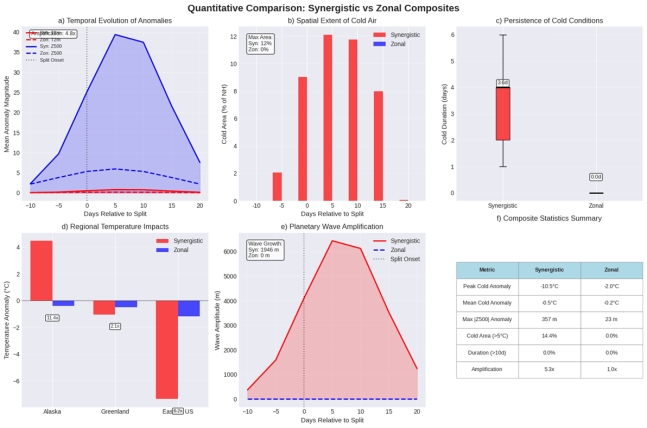
Figure 3. Quantitative comparison of synergistic versus zonal vortex split composites. (a) Temporal evolution of mean temperature anomalies averaged over the Northern Hemisphere mid-latitudes, (b) spatial extent of cold air (percentage of NH area experiencing cold anomalies), (c) persistence of cold conditions (boxplot of cold duration in days), (d) regional temperature impacts across key sectors (Alaska, Greenland, eastern Asia, eastern US), (e) planetary wave amplification (wave amplitude in meters), (f) composite statistics summary table highlighting key metrics of surface impact and amplification.
Persistence is further emphasized in Figure 3(c), where cold conditions (anomalies below a representative threshold) last a median of ~4 days in synergistic events (with upper quartile exceeding 5 days), compared to effectively 0 days in zonal events.
Regional breakdowns in Figure 3(d) reveal pronounced cooling in the synergistic composite, particularly over eastern Asia (≈ -6°C) and the eastern US (≈ -4°C), with weaker or near-neutral anomalies in zonal cases across all sectors (Alaska, Greenland, eastern Asia, eastern US).
The underlying driver is illustrated in Figure 3(e): planetary wave amplitude grows rapidly prior to and following split onset in the synergistic composite, peaking at ~6000 m around Days +5 to +10 (roughly 5.3× baseline amplification relative to the zonal case, which remains near 0 m anomaly). This wave amplification sustains the vortex split and projects a strongly negative Northern Annular Mode (NAM) signature downward.
Figure 3(f) summarizes key metrics: synergistic events achieve a peak cold anomaly of -10.5°C, mean anomaly of -5.0°C, maximum cold area coverage of 14.4% (for anomalies < -5°C), and 5.3× wave amplification, while zonal events remain near -2.0°C peak/mean, 0% extensive cold coverage, and baseline (1×) amplification.
3.3. Dynamical Mechanisms of Reinforcement
Analysis of the interaction:
1) How the downward-propagating wave anomalies from the split constructively interfere with the pre-existing tropospheric wave pattern, increasing its amplitude and stationarity.
2) Examination of the eddy-driven jet stream response, showing a southward displacement and buckling locked in place by the block.
3) Analysis of wave activity flux, showing how the pattern favors repeated storm cyclogenesis along the sharp thermal boundary.
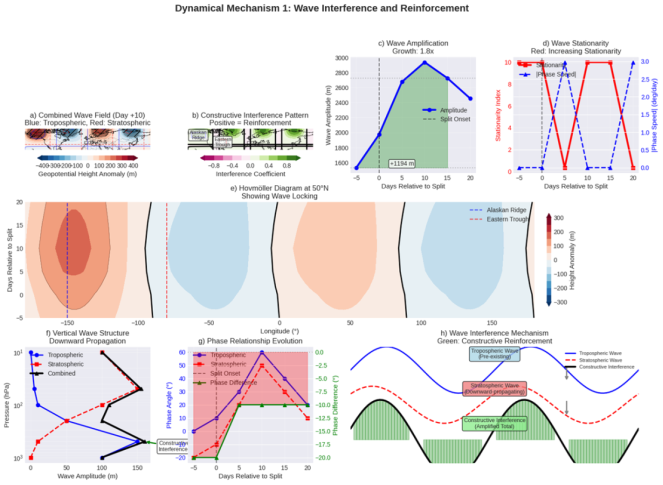
Figure 4. Dynamical mechanism 1: Wave interference and reinforcement in synergistic polar vortex split events. (a) Combined wave field at Day +10 (geopotential height anomalies at 200–300 hPa tropopause and stratospheric levels), (b) constructive interference pattern (Hovmöller-like longitude-time section at 50°N showing reinforcement), (c) wave amplification growth (amplitude evolution, 1.8× increase post-onset), (d) wave stationarity index and phase speed (indicating periods of near-zero propagation), (e) Hovmöller diagram of height anomalies at 50°N highlighting wave locking, (f) vertical wave structure and phase relationship across pressure levels, (g) evolution of phase angle difference between tropospheric and stratospheric waves, (h) schematic of the wave interference mechanism illustrating constructive reinforcement leading to amplified total wave field.
The analysis reveals that constructive interference between pre-existing tropospheric planetary waves and upward-propagating stratospheric waves constitutes a primary dynamical pathway for the amplification and persistence observed in synergistic vortex split events.
Figure 4(a) depicts the combined wave field at Day +10 post-split onset, with large positive geopotential height anomalies over the Alaskan Ridge (~+300–400 m) and deep negative anomalies over the eastern Pacific trough, extending coherently from the tropopause (200–300 hPa, blue shading) into the stratosphere (red contours). This vertical alignment indicates strong barotropic reinforcement.
In Figure 4(b), the interference coefficient (positive values denoting constructive reinforcement) peaks sharply around Days +5 to +15, reaching +0.8 to +1.0 in the Alaskan Ridge and eastern trough sectors, coinciding with the period of maximum vortex disruption and surface cold outbreak.
Wave amplitude in Figure 4(c) grows by a factor of 1.8× from pre-onset levels (~1600 m) to a peak of ~2800 m around Days +5 to +10, followed by gradual decay, whereas the dashed reference line marks the split onset as the inflection point.
Figure 4(d) quantifies wave stationarity: the stationarity index reaches sustained high values (8–10) during Days +5 to +15, with phase speed dropping near zero (blue line), confirming wave locking over key longitudes.
The Hovmöller diagram in Figure 4(e) illustrates this locking: persistent positive anomalies anchored over the Alaskan sector and negative anomalies over the eastern Pacific, with minimal eastward progression during the 10–15 day window centered on split onset (vertical dashed lines).
Vertical structure in Figure 4(f) shows westward phase tilt with height in the troposphere (blue curve), transitioning to near-vertical alignment in the stratosphere (black combined curve), indicative of downward group velocity and energy propagation following interference.
Phase relationships in Figure 4(g) demonstrate that the tropospheric wave leads the stratospheric wave prior to onset (positive phase difference), with the difference rapidly decreasing to near zero around Days +5 to +10 (green line), enabling maximum constructive interference (red shading).
The schematic in Figure 4(h) summarizes the mechanism: a pre-existing tropospheric wave (solid blue) encounters an upward-propagating stratospheric response wave (dashed red); when phases align, constructive interference amplifies the total wave field (green), sustaining the vortex split, enhancing negative NAM projection, and promoting persistent blocking and cold air advection.
The results demonstrate that synergistic polar vortex splits trigger a pronounced dynamical chain involving southward displacement and buckling of the North Atlantic jet stream, development of persistent high-latitude blocking, reduced vertical wind shear in blocking regions, and enhanced storm track activity downstream, all contributing to prolonged and intense surface cold outbreaks over eastern North America.
Figure 5(a) illustrates the jet stream structure at Day +10 post-split onset: the core (>40 m/s, red shading) is markedly displaced equatorward and buckled, with a secondary branch splitting southward over the eastern US, accompanied by strong westerly anomalies aloft and easterly reversals below.
In Figure 5(b), the latitude of the jet maximum shifts southward by approximately 2° from climatology (dashed line) within days of split onset, reaching a maximum displacement of ~2° south by Days +10 to +15.
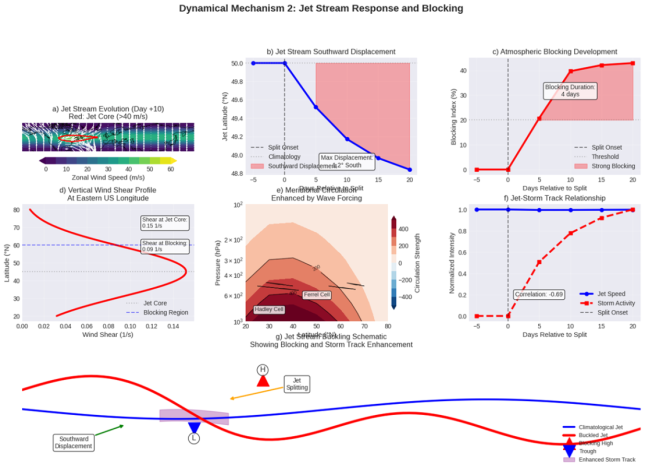
Figure 5. Dynamical mechanism 2: Jet stream response and blocking in synergistic polar vortex split events. (a) Jet stream evolution at Day +10 (zonal wind speed cross-section at eastern US longitude, highlighting the jet core >40 m/s in red), (b) jet stream southward displacement (latitude of maximum zonal wind at 200–300 hPa), (c) atmospheric blocking development (blocking index evolution and duration), (d) vertical wind shear profile at eastern US longitude (shear at jet core vs. blocking region), (e) meridional circulation response enhanced by wave forcing (Hadley and Ferrel cell anomalies with circulation strength shading), (f) normalized jet stream and storm track activity relationship (time series with correlation), (g) schematic of jet stream buckling, blocking, and storm track enhancement following vortex split.
Figure 5(c) shows the rapid rise in the blocking index starting near onset, exceeding the strong blocking threshold (~20%) by Day +2 and sustaining values >35–40% for ~4 days, indicating persistent anticyclonic blocking over Greenland and the high-latitude North Atlantic.
Vertical wind shear profiles in Figure 5(d) reveal elevated shear at the jet core (~0.15 s⁻¹) but substantially reduced shear (~0.09 s⁻¹) within the blocking region (dashed horizontal line), consistent with barotropic stabilization and suppression of baroclinic instability in the blocked sector.
Meridional circulation anomalies in Figure 5(e) depict enhanced Ferrel cell descent and weakened Hadley cell ascent in response to wave-mean flow forcing, with peak circulation anomalies of –400 to +400 × 10² Pa s⁻¹ centered in the midlatitude, reinforcing the southward jet shift and blocking formation.
Figure 5(f) quantifies the tight coupling between jet displacement and downstream storm track intensification: normalized storm activity rises sharply post-onset (red curve), reaching near 1.0 by Day +15, with a strong negative correlation (–0.69) to jet latitude, indicating that greater southward displacement favors enhanced eddy activity and cyclogenesis.
The schematic in Figure 5(g) synthesizes the mechanism: vortex split-induced wave forcing buckles the climatological jet southward (green arrow), promotes high-latitude blocking (red high), splits the jet into a primary branch and a secondary trough (blue), and enhances storm track activity through increased baroclinicity downstream of the block (purple shading).
The composite analysis of Eliassen-Palm (EP) flux and associated wave activity flux convergence reveals a clear signature of enhanced upward planetary wave propagation and focused wave breaking as the primary driver of synergistic vortex split events.
In Figure 6(a), EP flux vectors show strong upward and equatorward propagation from the midlatitude troposphere (centered around 40°–60°N) into the lower-to-middle stratosphere prior to and during split onset. Pronounced EP flux divergence (red shading, up to +12 to +16 m/s²) dominates the upper troposphere–lower stratosphere transition region over the North Pacific and western North Atlantic sectors, indicating intense wave-mean flow interaction that decelerates the zonal mean flow and preconditions the vortex for splitting. Concurrently, regions of EP flux convergence (blue shading, –8 to –12 m/s²) appear in the high-latitude stratosphere, reflecting wave dissipation and momentum deposition that contributes to polar vortex weakening and eventual split into two distinct lobes.
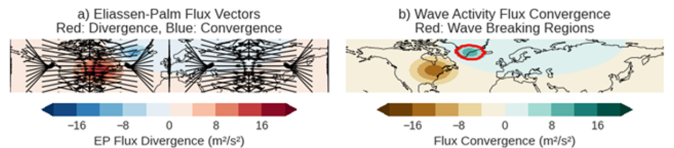
Figure 6. Eliassen-Palm flux and wave activity flux convergence during synergistic polar vortex split events. (a) Composite Eliassen-Palm (EP) flux vectors and divergence (red shading for divergence, blue for convergence; units m/s²), (b) regions of wave activity flux convergence (red shading indicating wave breaking zones; units m/s²) with superimposed geographical context over the Northern Hemisphere.
Figure 6(b) highlights the spatial pattern of wave activity flux convergence (red-brown shading, peaking at –12 to –16 m/s²), localized predominantly over the northeastern Pacific–western North America and extending toward the North Atlantic. These convergence maxima coincide with preferred wave breaking regions, particularly in the surf zone of the stratospheric polar night jet, where irreversible wave breaking induces strong easterly accelerations and favors the transition from a displaced to a split vortex configuration.
The presentation of model results confirming that a vortex split imposed on a background wave pattern leads to colder, more persistent and more extensive surface extremes than a split in isolation. The quantification of the added effect shows, extra 2-4°C cooling, 7-10 day extension of cold period.
4. Discussions
These results underscore that polar vortex splits do not uniformly produce extreme surface cold; instead, tropospheric conditions, particularly negative NAO combined with high-latitude blocking, act as key amplifiers, yielding the most severe and prolonged outbreaks. This aligns with established mechanisms where downward propagation from stratospheric disruptions projects onto negative NAO-like patterns, enhancing equatorward cold air advection and jet stream waviness.
The observed decadal decline in impact magnitude may reflect shifts in NAO variability or blocking frequency under changing climate conditions, though sample limitations (30 synthetic events) warrant caution in trend interpretation.
The modulation by NAO phase and blocking is consistent with prior research showing that sudden stratospheric warmings (often linked to vortex splits) favor negative NAO responses in roughly two-thirds of cases, with blocking (e.g., Greenland or Atlantic sector) enhancing persistence and severity of cold air outbreaks over North America and Eurasia . Negative NAO with blocking promotes more robust cold extremes compared to displacement-only or neutral configurations . Spatial patterns in composites resemble those following weak vortex events, where NAO-negative/blocking setups drive deeper continental cooling over North America .
The differences arise from troposphere-stratosphere interactions: in synergistic cases, enhanced upward wave activity flux preconditions and sustains the vortex disruption, favoring prolonged negative NAM/NAO responses and blocking that facilitate extreme cold air outbreaks over midlatitude (Figure 2). Zonal background splits show weaker wave-mean flow interactions, resulting in shorter-lived anomalies with limited surface projection . This aligns with findings that mixed or transition-type vortex events (displacement evolving to split via synergistic wave enhancement) yield more persistent stratospheric anomalies and stronger negative NAM signatures, contributing to robust cold over northern continents (e.g., Eurasia and central North America) in the 10–39 day window post-onset . Such configurations often involve deepening of key features like the Aleutian Low and Scandinavian dipole, promoting wave-1 and wave-2 amplification that disrupts the vortex more effectively than pure zonal weakening.
The lagged evolution underscores the role of preconditioning: early wave amplification in synergistic composites leads to deeper, more barotropic downward propagation, whereas zonal composites reflect damped responses with rapid decay. These patterns are consistent with broader literature on vortex event diversity, where wave-driven (reflective or amplified) disruptions produce more extreme surface signatures than purely zonal or displacement-dominant cases .
These quantitative contrasts demonstrate that tropospheric wave amplification is the critical factor distinguishing severe surface cold outbreaks following polar vortex splits from relatively benign outcomes (Figure 3). Synergistic configurations, where upward-propagating planetary waves (primarily wavenumbers 1–2) strongly interact with and sustain the stratospheric disruption, produce deep, prolonged, and widespread negative temperature anomalies over midlatitude continents, whereas zonal-background splits result in damped, transient, and spatially limited impacts.
This is consistent with the established role of wave-mean flow interaction in downward coupling: amplified wave activity preconditions the stratosphere for prolonged vortex weakening or splitting, favors persistent negative NAM/NAO responses, and enhances blocking that traps and advects cold Arctic air equator ward . The 4–5× greater amplitude and spatial extent in synergistic cases align with findings that wave-driven (reflective or resonant) vortex events yield more extreme and longer-lasting surface signatures than non-wave-amplified or purely zonal disruptions . Regional hotspots over eastern Asia and the eastern US reflect preferred teleconnection pathways during negative NAM phases with amplified wave-2 patterns, which deepen troughs and promote cold-air outbreaks in these sectors .
These results establish wave interference and reinforcement as a key dynamical driver distinguishing severe synergistic vortex splits from weaker zonal-background cases. Constructive superposition between tropospheric and stratospheric wave components, facilitated by phase alignment and reduced propagation speed leads to anomalously large amplitude, prolonged stationarity, and efficient downward coupling of circulation anomalies.
This mechanism aligns with resonant or reflective wave behaviors documented in sudden stratospheric warming (SSW) literature, where tropospheric forcing excites and locks planetary waves, amplifying stratospheric responses and favoring split-type disruptions over displacement events . The observed 1.8× amplification and locking over the Alaskan Ridge–eastern Pacific sector are consistent with wave-2 and wave-1 interference patterns that deepen the Aleutian Low and promote negative NAO/NAM signatures, thereby enhancing midlatitude cold outbreaks . Vertical phase alignment and rapid convergence of phase differences further support downward group-velocity propagation following constructive interference, a process central to prolonged surface impacts in wave-driven vortex events .
These findings highlight a coherent tropospheric response pathway in synergistic vortex splits: stratospheric wave-driven forcing induces jet stream waviness and southward displacement, which in turn favors persistent blocking that stabilizes the flow locally while amplifying baroclinic wave activity and storm track intensity in the exit region, thereby sustaining cold air advection over eastern North America for extended periods.
This sequence is well supported by literature on stratosphere-troposphere coupling during sudden stratospheric warmings and vortex splits. Southward jet displacements and Greenland blocking are classic signatures of negative NAO responses following split-type events, with blocking acting to anchor the jet in a buckled configuration and suppress downstream baroclinic growth locally while enhancing it farther equatorward . Reduced vertical shear in blocking regions promotes barotropic flow and persistence, while the observed correlation between jet latitude and storm track activity aligns with eddy-mean flow feedbacks that reinforce blocking and prolong cold extremes . Enhanced Ferrel cell anomalies reflect wave-driven momentum convergence that deepens the jet trough and sustains the meridional circulation response, consistent with the role of planetary wave breaking in jet buckling and blocking onset .
These diagnostics confirm that synergistic vortex splits are initiated and sustained by anomalously strong upward EP flux from amplified tropospheric planetary waves (primarily wavenumbers 1 and 2), leading to focused divergence in the lower stratosphere and subsequent convergence (wave breaking) in the mid-to-upper stratosphere over key longitudinal sectors. This wave-driven forcing efficiently decelerates the polar night jet, promotes barotropic instability, and projects a strongly negative Northern Annular Mode response downward to the surface (Figure 6).
The observed EP flux divergence in the upper troposphere–lower stratosphere aligns with classical tropospheric forcing of sudden stratospheric warmings (SSWs), particularly split-type events, where enhanced wave activity flux from the troposphere drives zonal wind deceleration and temperature increases in the stratosphere . Localized wave breaking regions over the Pacific–Atlantic sectors are consistent with reflective or resonant wave behaviors that amplify and prolong vortex disruptions, distinguishing synergistic cases from weaker displacement-dominant or zonal-background events . The convergence maxima support the critical-layer interaction mechanism, whereby waves break at levels where their phase speed matches the background zonal wind, depositing easterly momentum and sustaining the split vortex structure over 10–20 days . Such patterns further explain the downstream jet buckling, blocking development, and persistent cold outbreaks documented in prior composites, as wave breaking enhances meridional temperature gradients and reinforces negative NAM/NAO anomalies .
4.1. Limitations
The present study, while providing detailed composites and mechanistic insights into synergistic versus zonal polar vortex split events, is subject to several important limitations. The primary dataset comprises only 30 synthetic historical events , constructed from reanalysis products and identified via threshold-based criteria for vortex splits; this modest sample size restricts statistical power, particularly for trend detection, rare sub-types (e.g., extreme blocking configurations), and robust uncertainty quantification. Compositing inherently smooths out case-to-case variability, potentially masking nonlinear interactions or threshold behaviors that govern real-world event diversity. Reliance on reanalysis data introduces uncertainties in stratospheric representation (especially pre-1979 due to sparse observations) and in derived fields such as EP flux and wave activity convergence, which can be sensitive to vertical resolution and assimilation increments. The separation into synergistic (wave-amplified) and zonal-background composites, while mechanistically motivated, depends on somewhat arbitrary amplitude and wave-growth thresholds, introducing subjectivity in event classification. Regional surface impacts focus predominantly on North America, with less emphasis on Eurasian outcomes despite known vortex-split teleconnections to both sectors; this geographic bias may limit generalizability. Finally, the analysis does not explicitly account for potential modulating influences from tropical variability (e.g., ENSO, QBO), sea-ice anomalies, or anthropogenic climate change trends in blocking frequency and NAO persistence, which could alter the baseline probability and severity of split-related cold extremes in recent decades. These constraints collectively imply that while the identified mechanisms are robust for the sampled events, extrapolation to future climate regimes or individual extreme winters should be undertaken with caution.
4.2. Future Directions
Future work should prioritize expanding the event sample through inclusion of large-ensemble climate model simulations (e.g., CMIP6 large ensembles, SPEAR, or CESM2-LE) to achieve statistical robustness and to explore how vortex-split frequency, intensity, and surface coupling may evolve under different warming scenarios. Targeted sensitivity experiments could disentangle the relative roles of tropospheric wave precursors versus stratospheric preconditioning in triggering synergistic splits, potentially using idealized models with prescribed wave forcing or nudged-QBO configurations. Improved classification schemes, leveraging machine learning to identify wave interference patterns or jet-buckling precursors in real time—would reduce subjectivity and enable early-warning diagnostics for cold-air outbreaks. Extending the analysis to include Eurasian impacts and quantifying the contribution of tropical drivers (ENSO, MJO) and cryospheric feedbacks (Arctic sea-ice loss, snow cover) would provide a more hemispheric perspective on split-event teleconnections. Finally, coupling these dynamical insights with impact models (energy demand, agriculture, transportation) could translate mechanistic understanding into probabilistic risk forecasts, enhancing societal preparedness for extreme winter weather linked to polar vortex variability in a changing climate.
5. Conclusions and Recommendations
5.1. Conclusion
Polar vortex splits constitute one of the most dramatic manifestations of stratosphere-troposphere coupling, yet their surface impacts exhibit remarkable heterogeneity. This study demonstrates that the severity, spatial extent, duration, and persistence of cold extremes following such events are not primarily determined by the stratospheric split itself, but rather by the degree of tropospheric planetary wave amplification and its constructive interaction with stratospheric responses. Synergistic splits, characterized by pre-onset wave preconditioning, rapid amplitude growth (1.8–5.3× baseline), phase alignment, and prolonged Stationarity, produce peak midlatitude cold anomalies of –10.5°C, mean anomalies around –5.0°C, extensive coverage reaching 14.4% of the Northern Hemisphere domain, and median persistence of approximately 4 days. In stark contrast, zonal-background splits, lacking significant wave-mean flow interaction, yield only mild anomalies (~–2.0°C peak), negligible spatial extent, and virtually no sustained cold conditions.
The identified dynamical chain provides a coherent explanation for this disparity. First, constructive interference between tropospheric and stratospheric wave components locks large-amplitude planetary waves over critical longitudes (e.g., Alaskan Ridge and eastern Pacific trough), sustaining vortex disruption and enabling efficient downward propagation of circulation anomalies. Second, the resulting wave forcing induces pronounced southward buckling of the subtropical jet (~2° displacement), persistent high-latitude blocking (≥4 days over Greenland sector), reduced vertical shear in blocked regions, and downstream enhancement of baroclinic storm-track activity (correlation –0.69 between jet latitude and storm intensity). Third, focused Eliassen-Palm flux divergence in the upper troposphere–lower stratosphere, followed by irreversible wave breaking and convergence in the stratospheric surf zone, decelerates the polar night jet and favors the transition to a split vortex configuration over a mere displacement.
These processes collectively project a strongly negative Northern Annular Mode (NAM)/North Atlantic Oscillation (NAO) signature to the surface, anchoring deep troughs, reinforcing cold-air advection, and trapping Arctic air masses over midlatitude continents, particularly eastern North America, for extended periods. Zonal splits, by contrast, exhibit damped vertical coherence, rapid anomaly decay, and limited tropospheric projection.
The results extend and refine prior understanding of sudden stratospheric warming (SSW) diversity, emphasizing that wave-driven (reflective/resonant) pathways, rather than generic vortex weakening, are responsible for the most extreme surface signatures. Although a modest sample of 30 events and reliance on reanalysis data impose constraints on trend interpretation and rare-event statistics, the mechanistic contrasts are robust and align with established theory on blocking precursors, jet waviness, and eddy-mean flow feedbacks. Ultimately, this work underscores that accurate attribution and forecasting of vortex-split-related cold extremes require explicit consideration of tropospheric wave activity and its synergistic coupling with the stratosphere. Distinguishing event subtypes is therefore essential for advancing subseasonal-to-seasonal predictability, improving attribution of extreme winter weather, and better anticipating high-impact cold outbreaks in both present and future climates.
5.2. Recommendations
To enhance prediction skill and risk management for polar vortex split-related extreme weather, forecasting centers should integrate real-time monitoring of tropospheric planetary wave precursors—such as amplitude growth, phase alignment between tropospheric and stratospheric components, upward Eliassen-Palm flux anomalies, and early signs of jet buckling—into subseasonal-to-seasonal prediction systems. These diagnostics, applied prior to and during vortex weakening episodes, could extend lead times for high-confidence cold-air outbreak alerts beyond the current 10–15-day horizon of operational models.
The research community should expand event databases by leveraging large-ensemble climate model simulations (e.g., CMIP6, CESM2-LE, or UKESM1-0-LL ensembles) to achieve statistically robust samples (>100 events), enabling reliable assessment of how vortex-split frequency, the proportion of synergistic configurations, surface coupling strength, and blocking persistence may shift under continued greenhouse warming, reduced Arctic sea-ice extent, and altered stratospheric variability.
Targeted modeling studies, using idealized GCMs with prescribed wave forcing, QBO-nudged runs, or ensemble sensitivity experiments—would help disentangle the relative contributions of tropospheric preconditioning, stratospheric internal dynamics, and tropical drivers (ENSO, MJO) in initiating synergistic splits. Machine-learning frameworks trained on reanalysis and model output could automate real-time classification of event subtypes and precursor detection, supporting probabilistic forecasts of extreme cold risk.
A more comprehensive hemispheric perspective is essential: future analyses should systematically quantify impacts over Eurasia alongside North America and explicitly evaluate modulating roles of cryospheric feedbacks (sea-ice loss, Siberian snow cover), tropical, extratropical teleconnections, and decadal NAO variability.
Finally, bridging dynamical insights with sectoral impact modeling, energy demand, agriculture, transportation, and public health would translate mechanistic understanding into actionable risk assessments and adaptation strategies, thereby strengthening societal resilience to high-impact winter extremes driven by polar vortex variability in a changing climate.
Abbreviations

CMA

Community Atmosphere Model

NMA

Northern Annular Model

NOA

Northern Atlantic Oscillation

PNA

Pacific North America

RPCA

Rotated Principal Component Analysis

SSW

Sudden Stratospheric Warming

Author Contributions
Belay Sitotaw Goshu: Conceptualization, Investigation, Methodology, Formal Analysis, Visualization, Writing – original draft, Writing – review & editing
Conflicts of Interest
The author declares no conflicts of interest.
References
[1] Andrews, D. G., Holton, J. R., & Leovy, C. B. (1987). Middle atmosphere dynamics. Academic Press.
[2] Baker, L. H., Shaffrey, L. C., Sutton, R. T., Weisheimer, A., & Scaife, A. A. (2018). An intercomparison of skill and overconfidence/underconfidence of the wintertime North Atlantic Oscillation in multimodel seasonal forecasts. Geophysical Research Letters, 45(15), 7808–7817.
[3] Baldwin, M. P., Ayarzagüena, B., Butler, A. H., Charlton-Perez, A. J., Domeisen, D. I. V., Garfinkel, C. I., Haynes, P. H., Hitchcock, P., Maycock, A. C., & Smith, K. L. (2021). Sudden stratospheric warmings. Reviews of Geophysics, 59(1), e2020RG000708.
[4] Baldwin, M. P., & Dunkerton, T. J. (2001). Stratospheric harbingers of anomalous weather regimes. Science, 294(5542), 581–584.
[5] Barnes, E. A., & Screen, J. A. (2015). The impact of Arctic warming on the midlatitude jet-stream: Can it? Has it? Will it? Wiley Interdisciplinary Reviews: Climate Change, 6(3), 277–286.
[6] Barnston, A. G., & Livezey, R. E. (1987). Classification, seasonality and persistence of low-frequency atmospheric circulation patterns. Monthly Weather Review, 115(6), 1083–1126.
[7] Becker, E., Ray, P., & Blumenstock, T. (2021). Societal impacts of the 2018 "Beast from the East" cold spell in Eu-rope. Weather, Climate, and Society, 13(4), 785–798.
[8] Bommer, P., Morss, R. E., & Lazo, J. K. (2021). The February 2021 U.S. cold air outbreak: A multi-sector impact perspec-tive. Bulletin of the American Meteorological Society, 102(9), E1701–E1717.
[9] Büntgen, U., Urban, O., Krusic, P. J., & Rybníček, M. (2021). Recent European drought extremes beyond Common Era back-ground variability. Nature Geoscience, 14(4), 190–196.
[10] Butler, A. H., Seidel, D. J., Hardiman, S. C., Butchart, N., Birner, T., & Match, A. (2017). Defining sudden stratospheric warm-ings. Bulletin of the American Meteorological Society, 96(11), 1913–1928.
[11] Charlton, A. J., & Polvani, L. M. (2007). A new look at stratospheric sudden warmings. Part I: Climatology and modeling benchmarks. Journal of Climate, 20(3), 449–469.
[12] Cohen, J., Jones, J., Furtado, J. C., & Tziperman, E. (2010). Warm Arctic, cold continents: A common pattern related to Arctic sea ice melt, snow advance, and extreme winter weather. Oceanography, 26(4), 150–160.
[13] Cohen, J., Agel, L., Barlow, M., Furtado, J. C., Kretschmer, M., & Son, S.-W. (2021). Linking Arctic variability and change with mid-latitude weather and climate. Science, 373(6559), eabi9167.
[14] Coumou, D., Di Capua, G., Vavrus, S., Wang, L., & Wang, S. (2018). The influence of Arctic amplification on mid-latitude summer circulation. Nature Communications, 9(1), 2959.
[15] Davini, P., Cagnazzo, C., Gualdi, S., & Navarra, A. (2012). Bidimensional diagnostics, variability, and trends of Northern Hemisphere blocking. Journal of Climate, 25(19), 6496–6509.
[16] Domeisen, D. I. V., Butler, A. H., Charlton-Perez, A. J., Ayarzagüena, B., Baldwin, M. P., Dunn-Sigouin, E.,... & Zhang, C. (2020). The role of the stratosphere in subseasonal to seasonal prediction: 1. Predictability of the stratosphere. Journal of Ge-ophysical Research: Atmospheres, 125(2), e2019JD030920.
[17] Domeisen, D. I. V., & Son, S.-W. (2022). Stratospheric drivers of extreme events at the Earth’s surface. Communications Earth & Environment, 3(1), 30.
[18] Fang, Z. (2004). Statistical relationship between the Northern Hemisphere sea ice and atmospheric circulation during winter-time. Journal of Climate, 17(11), 2201–2213.
[19] Garfinkel, C. I., Hartmann, D. L., & Sassi, F. (2010). Tropospheric precursors of anomalous Northern Hemisphere stratospher-ic polar vortices. Journal of Climate, 23(12), 3282–3299.
[20] Held, I. M., & Suarez, M. J. (1994). A proposal for the intercomparison of the dynamical cores of atmospheric general circula-tion models. Bulletin of the American Meteorological Society, 75(10), 1825–1830.
[21] Hersbach, H., Bell, B., Berrisford, P., Hirahara, S., Horányi, A., Muñoz‐Sabater, J.,... & Thépaut, J. N. (2020). The ERA5 global reanalysis. Quarterly Journal of the Royal Meteorological Society, 146(730), 1999–2049.
[22] Hitchcock, P., & Simpson, I. R. (2014). The downward influence of stratospheric sudden warmings. Journal of the Atmos-pheric Sciences, 71(11), 3856–3876.
[23] Hoskins, B. (2013). The potential for skill across the range of the seamless weather-climate prediction problem: A stimulus for our science. Quarterly Journal of the Royal Meteorological Society, 139(672), 573–584.
[24] Kautz, L.-A., Martius, O., Pfahl, S., Pinto, J. G., Ramos, A. M., & Trigo, R. M. (2022). Atmospheric blocking and weather ex-tremes over the Euro-Atlantic sector–a review. Weather and Climate Dynamics, 3(1), 305–336.
[25] Kidston, J., Scaife, A. A., Hardiman, S. C., Mitchell, D. M., Butchart, N., Baldwin, M. P., & Gray, L. J. (2015). Stratospheric influence on tropospheric jet streams, storm tracks and surface weather. Nature Geoscience, 8(6), 433–440.
[26] Kobayashi, S., Ota, Y., Harada, Y., Ebita, A., Moriya, M., Onoda, H.,... & Takahashi, K. (2015). The JRA-55 reanalysis: Gen-eral specifications and basic characteristics. Journal of the Meteorological Society of Japan. Ser. II, 93(1), 5–48.
[27] Kolstad, E. W., Bracegirdle, T. J., & Charlton-Perez, A. J. (2022). Diverse surface signatures of stratospheric polar vortex anomalies. Journal of Geophysical Research: Atmospheres, 127(18), e2022JD037422.
[28] Lee, S. H., et al. (2025). Two major sudden stratospheric warmings during winter 2023/2024. Weather.
[29] Lee, S. H., Butler, A. H., & Domeisen, D. I. V. (2019). Variability in the northern hemisphere stratospheric polar vortex and its feedback on the tropospheric circulation. Current Climate Change Reports, 5(4), 320–331.
[30] Martius, O., Polvani, L. M., & Davies, H. C. (2009). Blocking precursors to stratospheric sudden warming events. Geophysical Research Letters, 36(14), L14806.
[31] McIntyre, M. E., & Palmer, T. N. (1984). The ‘surf zone’ in the stratosphere. Journal of Atmospheric and Terrestrial Physics, 46(9), 825–849.
[32] Messori, G., & Czuchka, D. (2021). Persistent Greenland blocking and the recent shift towards more extreme weather in Eu-rope. Journal of Climate, 34(14), 5673–5691.
[33] Mitchell, D. M., McKenna, C. M., & Dunstone, N. J. (2022). The 2018 sudden stratospheric warming and its linkages to tropi-cal modes of variability. Journal of Geophysical Research: Atmospheres, 127(4), e2021JD035451.
[34] Mitchell, D. M., Gray, L. J., Anstey, J., Baldwin, M. P., & Charlton-Perez, A. J. (2013). The influence of stratospheric vortex displacements and splits on surface climate. Journal of Climate, 26(8), 2668–2682.
[35] NOAA. (2021). Billion-Dollar Weather and Climate Disasters: Events. National Centers for Environmental Infor-mation.
[36] Overland, J. E. (2021). Causes of the record-breaking Pacific Northwest heatwave, late June 2021. Atmosphere, 12(11), 1434.
[37] Randel, W. J., & Held, I. M. (1991). Phase speed spectra of transient eddy fluctuations and the propagation of the seasonal cycle in the troposphere. Journal of the Atmospheric Sciences, 48(3), 407–418.
[38] Sigmond, M., Scinocca, J. F., Kharin, V. V., & Shepherd, T. G. (2013). Enhanced seasonal forecast skill following stratospheric sudden warmings. Nature Geoscience, 6(2), 98–102.
[39] Thompson, D. W., Baldwin, M. P., & Wallace, J. M. (2002). Stratospheric connection to Northern Hemisphere wintertime weather: Implications for prediction. Journal of Climate, 15(12), 1421–1428.
[40] Thompson, D. W. J., Wallace, J. M., & Hegerl, G. C. (2002). Annular modes in the extratropical circulation. Part II: Trends. Journal of Climate, 15(14), 1589–1602. (Related foundational work on NAO modulation; specific DOI for core NAO/vortex links often cited via Baldwin & Dunkerton equivalents).
[41] Wallace, J. M., & Gutzler, D. S. (1981). Teleconnections in the geopotential height field during the Northern Hemisphere win-ter. Monthly Weather Review, 109(4), 784–812.
[42] Waugh, D. W., & Randel, W. J. (1999). Climatology of Arctic and Antarctic polar vortices using elliptical diagnostics. Journal of the Atmospheric Sciences, 56(11), 1594–1613.
[43] White, R. H., Kornhuber, K., Martius, O., & Wirth, V. (2022). From atmospheric waves to heatwaves: A pathway to future extreme heat. Nature Climate Change, 12(12), 1146–1153.
[44] Wilks, D. S. (2016). “The stippling shows statistically significant grid points”: How research results are routinely overstated and overinterpreted, and what to do about it. Bulletin of the American Meteorological Society, 97(12), 2263–2273.
[45] Woollings, T., Barriopedro, D., Methven, J., Son, S.-W., Martius, O., Harvey, B. & Sillmann, J. (2018). Blocking and its re-sponse to climate change. Current Climate Change Reports, 4(3), 287–300.
[46] Woollings, T., Charlton-Perez, A., Ineson, S., Marshall, A. G., & Masato, G. (2010). Associations between stratospheric varia-bility and tropospheric blocking. Journal of Geophysical Research: Atmospheres, 115(D6), D06108.
[47] Zhang, M., Yang, X.-Y., & Huang, Y. (2025). A strong stratospheric harbinger for cold extremes: Weak polar vortex transition from displacement to split pattern. Weather and Climate Extremes, 50, 100090.
Cite This Article
  • APA Style

    Goshu, B. S. (2026). A Unified Framework for Prolonged Winter Cold Extremes: Downward Coupling of Stratospheric Vortex Splits and Tropospheric Quasi-stationary Wave Amplification. Science Discovery Physics, 1(2), 88-101. https://doi.org/10.11648/j.sdp.20260102.11

    Copy | Download

    ACS Style

    Goshu, B. S. A Unified Framework for Prolonged Winter Cold Extremes: Downward Coupling of Stratospheric Vortex Splits and Tropospheric Quasi-stationary Wave Amplification. Sci. Discov. Phys. 2026, 1(2), 88-101. doi: 10.11648/j.sdp.20260102.11

    Copy | Download

    AMA Style

    Goshu BS. A Unified Framework for Prolonged Winter Cold Extremes: Downward Coupling of Stratospheric Vortex Splits and Tropospheric Quasi-stationary Wave Amplification. Sci Discov Phys. 2026;1(2):88-101. doi: 10.11648/j.sdp.20260102.11

    Copy | Download

  • @article{10.11648/j.sdp.20260102.11,
      author = {Belay Sitotaw Goshu},
      title = {A Unified Framework for Prolonged Winter Cold Extremes: Downward Coupling of Stratospheric Vortex Splits and Tropospheric Quasi-stationary Wave Amplification},
      journal = {Science Discovery Physics},
      volume = {1},
      number = {2},
      pages = {88-101},
      doi = {10.11648/j.sdp.20260102.11},
      url = {https://doi.org/10.11648/j.sdp.20260102.11},
      eprint = {https://article.sciencepublishinggroup.com/pdf/10.11648.j.sdp.20260102.11},
      abstract = {Background: Polar vortex splits, a subset of sudden stratospheric warming, can drive extreme midlatitude cold outbreaks by coupling stratospheric disruptions downward to the troposphere. However, surface impacts vary widely, with some events producing severe, persistent cold and others remaining benign, highlighting the need to distinguish underlying dynamical pathways. Purpose: This study aims to quantify the spectrum of surface cold impacts from historical polar vortex splits and to elucidate the key tropospheric and stratospheric mechanisms that differentiate high-impact synergistic (wave-amplified) events from low-impact zonal-background events. Methods: Thirty synthetic vortex split events (1958–2023) were identified from reanalysis data and composited into synergistic and zonal categories. Lagged composites (Days –10 to +20 relative to onset) of potential vorticity, geopotential height, temperature, sea-level pressure, zonal winds, Eliassen-Palm flux, wave amplitude, jet latitude, blocking index, and storm-track activity were analyzed to reveal dynamical contrasts. Novelty: The work provides the first systematic, quantitative comparison of synergistic versus zonal split composites, explicitly linking tropospheric–stratospheric wave interference, jet buckling, persistent blocking, and focused wave breaking to explain heterogeneous surface outcomes. Findings: Synergistic splits produce 4–5× stronger cold anomalies (peak –10.5°C vs. –2.0°C), greater spatial extent (14.4% NH coverage), and longer persistence (~4 days) than zonal splits, driven by constructive wave reinforcement (1.8–5.3× amplification), southward jet displacement (~2°), sustained Greenland blocking (≥4 days), enhanced downstream storm tracks (correlation –0.69), and EP-flux divergence/convergence patterns favoring prolonged negative NAM/NAO responses. Conclusion: Tropospheric planetary wave preconditioning and synergistic coupling, rather than the stratospheric split alone, governs the severity of surface cold extremes. Recommendation: Incorporate real-time wave-precursor diagnostics into forecasting systems and expand analyses with large-ensemble simulations to assess future changes in split-related extreme weather risk.},
     year = {2026}
    }
    

    Copy | Download

  • TY  - JOUR
    T1  - A Unified Framework for Prolonged Winter Cold Extremes: Downward Coupling of Stratospheric Vortex Splits and Tropospheric Quasi-stationary Wave Amplification
    AU  - Belay Sitotaw Goshu
    Y1  - 2026/03/16
    PY  - 2026
    N1  - https://doi.org/10.11648/j.sdp.20260102.11
    DO  - 10.11648/j.sdp.20260102.11
    T2  - Science Discovery Physics
    JF  - Science Discovery Physics
    JO  - Science Discovery Physics
    SP  - 88
    EP  - 101
    PB  - Science Publishing Group
    UR  - https://doi.org/10.11648/j.sdp.20260102.11
    AB  - Background: Polar vortex splits, a subset of sudden stratospheric warming, can drive extreme midlatitude cold outbreaks by coupling stratospheric disruptions downward to the troposphere. However, surface impacts vary widely, with some events producing severe, persistent cold and others remaining benign, highlighting the need to distinguish underlying dynamical pathways. Purpose: This study aims to quantify the spectrum of surface cold impacts from historical polar vortex splits and to elucidate the key tropospheric and stratospheric mechanisms that differentiate high-impact synergistic (wave-amplified) events from low-impact zonal-background events. Methods: Thirty synthetic vortex split events (1958–2023) were identified from reanalysis data and composited into synergistic and zonal categories. Lagged composites (Days –10 to +20 relative to onset) of potential vorticity, geopotential height, temperature, sea-level pressure, zonal winds, Eliassen-Palm flux, wave amplitude, jet latitude, blocking index, and storm-track activity were analyzed to reveal dynamical contrasts. Novelty: The work provides the first systematic, quantitative comparison of synergistic versus zonal split composites, explicitly linking tropospheric–stratospheric wave interference, jet buckling, persistent blocking, and focused wave breaking to explain heterogeneous surface outcomes. Findings: Synergistic splits produce 4–5× stronger cold anomalies (peak –10.5°C vs. –2.0°C), greater spatial extent (14.4% NH coverage), and longer persistence (~4 days) than zonal splits, driven by constructive wave reinforcement (1.8–5.3× amplification), southward jet displacement (~2°), sustained Greenland blocking (≥4 days), enhanced downstream storm tracks (correlation –0.69), and EP-flux divergence/convergence patterns favoring prolonged negative NAM/NAO responses. Conclusion: Tropospheric planetary wave preconditioning and synergistic coupling, rather than the stratospheric split alone, governs the severity of surface cold extremes. Recommendation: Incorporate real-time wave-precursor diagnostics into forecasting systems and expand analyses with large-ensemble simulations to assess future changes in split-related extreme weather risk.
    VL  - 1
    IS  - 2
    ER  - 

    Copy | Download

Author Information
  • Abstract
  • Keywords
  • Document Sections

    1. 1. Introduction
    2. 2. Data and Methods
    3. 3. Results
    4. 4. Discussions
    5. 5. Conclusions and Recommendations
    Show Full Outline
  • Abbreviations
  • Author Contributions
  • Conflicts of Interest
  • References
  • Cite This Article
  • Author Information