Research Article | | Peer-Reviewed

Development and Nutritional Optimization of a Healthy Snack Bar for Children Using Locally Available Ingredients

Received: 31 May 2025     Accepted: 18 June 2025     Published: 31 July 2025
Views:       Downloads:
Abstract

The rising global demand for healthy, convenient, and ready-to-eat foods has increased the popularity of snack bars, valued for their energy density and portability. This study aimed to develop nutritious snack bars for children using locally available ingredients: oats, faba beans, sunflower seeds, and flax seeds. A mixture design supported by Minitab v.18 generated 17 formulations with varying ingredient ratios. Rosemary leaf extract was added to enhance antioxidant properties, and jaggery was used as a natural sweetener. Proximate analysis showed moisture content of 6-8%, ash 1.12-2.57%, fiber 2-3.5%, fat 5-7%, protein 20-24%, and carbohydrates 58-62%, yielding an energy value of 393-400 Kcal/100g. Mineral content included sodium (5-7 mg), potassium (364-440 mg), calcium (4-8 mg), and magnesium (118-121 mg), with micro-minerals copper (0.4-1.67 mg), iron (6-9.25 mg), and zinc (4-7.5 mg) per 100g. The optimal formulation, with a composite desirability of 0.940494, comprised 48.18g oats, 39.80g faba beans, 4g sunflower seeds, and 8.01g flax seeds. Sensory evaluation confirmed its high acceptability, and microbial analysis verified product safety for up to 30 days of storage.

Published in Science Frontiers (Volume 6, Issue 3)
DOI 10.11648/j.sf.20250603.11
Page(s) 34-56
Creative Commons

This is an Open Access article, distributed under the terms of the Creative Commons Attribution 4.0 International License (http://creativecommons.org/licenses/by/4.0/), which permits unrestricted use, distribution and reproduction in any medium or format, provided the original work is properly cited.

Copyright

Copyright © The Author(s), 2025. Published by Science Publishing Group

Keywords

Food Products Malnutrition, Natural Sweetener, Proximate Analysis, Snack Bar

1. Introduction
1.1. Background of the Study
Snack bars are complex food items generally created from a combination of cereals, legumes, and oilseeds, aimed at increasing nutrient density and offering various health benefits. Originally designed as energy boosters for athletes, these bars have transformed into practical and nutritious options for a wider audience, including children in schools. Their rising popularity reflects a global shift towards healthier eating habits, especially in low- and middle-income nations where diets frequently lack adequate protein, energy, and vital micronutrients .
Students and professionals often opt for snack foods for various reasons, including substituting breakfast, convenient nutrition, and boosting energy levels. However, creating an optimal snack bar necessitates a careful selection of ingredients that serve specific purposes such as sweeteners, binders, flavor enhancers, and nutrient-rich components . This requirement is particularly critical in nations like Ethiopia, where malnutrition is a pressing issue. Reports from the FAO/WHO indicate that approximately 30% of children of school age in Ethiopia experience severe malnutrition .
Key Ingredients and Nutritional Importance
Oats, scientifically known as Avena sativa, are whole grains that are abundant in β-glucan, dietary fiber, protein, calcium, and essential fatty acids. They are primarily grown in countries such as Russia, Canada, Australia, and Finland, with a total global production surpassing 22 million tons, as reported by Webster & Wood in 2011 and Taneyo Saa in 2014 .
Faba Beans (Vicia faba) which hold the third position among the world's legumes, following soybeans and peas. These beans are characterized by their high protein content (31-34%), significant carbohydrates (44-47%), and dietary fiber, while also providing essential micronutrients, albeit with a low fat content (2-5%) .
Sunflower (Helianthus annuus) and Flaxseed (Linum usitatissimum): They are crucial oilseeds, recognized for their unsaturated fats, proteins, vitamin E, and important minerals such as selenium and zinc . Additionally, Rosemary (Salvia rosmarinus) serves as a natural preservative, leveraging its antioxidant properties to enhance shelf life without the need for synthetic additives . Furthermore, Jaggery, a traditional form of unrefined sugar, provides nutritional benefits compared to white sugar, being abundant in minerals, proteins, and complex carbohydrates including sucrose, glucose, and fructose . The goal of this study is to create snack bars that are high in antioxidants and nutrients using oats, faba beans, sunflower seeds, and flaxseed, in light of consumers' preference for minimally processed, nutritionally balanced convenience meals. These bars fulfill the needs of contemporary lives while acting as a useful dietary intervention to fight malnutrition .
1.2. Types of Snack Bars
The types of snack bars differ according to their intended use and nutritional value. Health and wellness bars, organic bars, and energy/nutrition bars are the three primary types of snack bars .
1.2.1. Cereal Bars
Grain types like wheat, rice, maize, sorghum, oats, and barley make up the majority of cereal bars. They provide a rich amount of proteins, carbs, and dietary fiber and are usually bound together with binders such as glucose syrup . For a better texture and nutritional profile, these bars also include fruits, nuts, and seeds .
1.2.2. Legume Bars
Plant protein, dietary fiber, and bioactive chemicals that have health benefits like lowering LDL cholesterol and protecting the heart can all be found in abundance in legumes . Together with cereals, they provide a full protein profile that makes up for deficiencies in certain amino acids, such as cysteine and methionine .
1.2.3. Sweet Bars
Sweet snacks that are traditionally prepared are frequently heavy in salt, saturated fats, and refined sugar, which can lead to health problems related to nutrition. Consumer tastes, however, are moving toward minimally processed, naturally sweetened snacks that maintain their nutritional value and flavor .
1.2.4. Energy Bars
Energy bars are nutrient-dense, high-calorie foods manufactured from seeds, grains, and plants. They are frequently enhanced with vitamins, minerals, and phytochemicals and offer 200-300 kcal per bar . Particularly among teenagers and fitness fanatics, their popularity is rising.
1.2.5. Sports Bars
Sports bars are made for athletes and are rich in B vitamins, protein, and carbs. They provide rapid energy and vital minerals and are frequently created with ingredients like dates and oats .
1.3. Nutritional Value of Snack Ingredients
A balanced combination of macronutrients (fats, proteins, and carbs) and vital micronutrients (vitamins and minerals) can be found in snack bars, which are portable, ready-to-eat functional foods. They are becoming more and more integrated into contemporary diets because of their nutrient profiles, shelf stability, and mobility, particularly as meal replacements or energy enhancers for kids, athletes, and health-conscious customers . The choice and ratio of raw components, such as cereals, legumes, seeds, nuts, and fruits, determines the nutritional makeup of snack bars. Complex carbohydrates and soluble fibers, including β-glucan, which lowers cholesterol and supports gut health, are provided by whole grains like oats . High-quality plant-based protein and dietary fiber are provided by legumes including faba beans and chickpeas, which also add to the product's overall amino acid composition . The addition of dried fruits raises the vitamin and mineral content, particularly potassium, vitamins A and C, and natural sugars that give you energy right away . The World Health Organization (WHO) and the Food and Agriculture Organization (FAO) are two international health organizations that have suggested that snack products targeted at school-aged children have an iron concentration of 10-15 mg per 100 g. This barrier has been effectively exceeded by numerous recently created formulations, aiding in the treatment of micronutrient shortages such iron-deficiency anemia . Snack bars that are thoughtfully created can therefore help close nutritional gaps in disadvantaged groups and improve the quality of diets.
1.4. Anti-Nutritional Factors of Raw Materials
Although the ingredients selected for snack bar formulations are rich in nutrients, many plant-based raw materials naturally contain anti-nutritional factors (ANFs). These compounds can interfere with the digestion, absorption, and utilization of nutrients. Common ANFs include phytates, tannins, oxalates, saponins, and enzyme inhibitors such as trypsin and chymotrypsin inhibitors . To mitigate the adverse effects of these ANFs and improve the nutritional quality of the final product, various pre-treatment methods were employed. These included soaking, dehulling, thermal processing (roasting or boiling), and enzymatic treatments . Such processing techniques are effective in reducing ANF concentrations while preserving or enhancing the bioavailability of desirable nutrients. Moreover, these treatments improve the sensory characteristics and shelf stability of the final snack bars .
1.4.1. Oats
Oats (Avena sativa) are a highly valued cereal grain widely used in snack bar formulations due to their favorable nutrient profile, including high levels of dietary fiber, proteins, and phenolic compounds. However, raw oats contain notable levels of phytates (phytic acid) and tannins, both of which can chelate minerals like calcium, iron, and zinc, thereby reducing their bioavailability . To address this, oats undergo processing methods such as soaking, steaming, flaking, roasting, and popping. These techniques disrupt the phytate structure and inactivate other anti-nutritional factors (ANFs), thereby enhancing mineral absorption and overall digestibility. Additionally, thermal processing helps release bound phenolic compounds, increasing their antioxidant activity and making oats a dual-purpose ingredient nutrient-dense and functionally active .
1.4.2. Faba Beans
Faba beans (Vicia faba L.) are a rich source of protein, dietary fiber, complex carbohydrates, and essential micronutrients such as iron, magnesium, and folate. However, their use is limited by the presence of several anti-nutritional factors (ANFs), including trypsin inhibitors, tannins, vicine, convicine, and lectins. These substances can interfere with protein digestion, reduce amino acid availability, and in some cases, cause hemolytic anemia in susceptible individuals (e.g., those with G6PD deficiency due to vicine and convicine) . To reduce these risks and improve the nutritional efficacy of faba beans in snack bar formulations, traditional and modern processing techniques such as soaking, germination, dehulling, autoclaving, and boiling are applied. These methods significantly lower the concentrations of ANFs, particularly tannins and enzyme inhibitors, while also enhancing protein digestibility and palatability . Proper processing thus enables the safe and effective inclusion of faba beans as a plant-based protein source in functional snack products.
2. Materials and Methods
2.1. Flow Chart of Overall Research Design
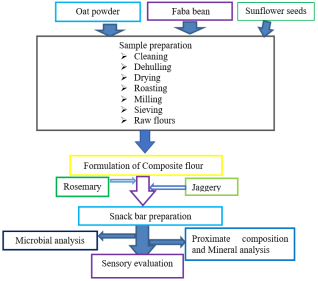
Figure 1. Flow chart of overall methodology design.
2.2. Sample Collection and Preparation
All the Samples such as Oats, faba bean, sun flower, flax seed and rosemary leaves were collected from konso city market. The collected samples were stored in packing material (polyethylene bags) and transported to the laboratory.
2.3. Processing of Raw Materials
The raw materials were selected on the basis of availability of the ingredients given their nutritious composition, especially oats rich in fiber, minerals and antioxidants, faba bean rich in essential amino acids (e.g. lysine), flex seed excellent source of fiber and omega 3 fatty acids and rich in antioxidants and sun flowers seeds plenty of other bioactive components to give versatile taste and flavor enhance the sensory characteristics.
All the ingredients needed for preparation of snack bars such as oats, faba bean, flax seeds, sunflower seeds, and rosemary leaves were purchased from local market in Konso town. Jaggery (non-residual sugar) needed for this study was purchased from Addis Ababa. All the materials were examined properly for foreign matter and relevant processing (roasting, grinding and mixing) was done. Addition of jiggery was done the main binding agents of the ingredients used to wrap the dry ingredients of the bar, and to allow their aggregation uniformly spread in a rectangular pan (20 cm × 8 cm) to a thickness of 2 cm. The bars were then allowed to cool for 30minutes and subsequently cut into evenly sized bars measuring 8.5 cm × 2.5 cm.
2.3.1 Oat Processing
The sample of oat flakes was cleaned by air aspiration and screens of different sizes to get rid of undesirable particles and foreign objects. Using a mortar and pestle, the oats were dehulled after being cleaned. They used the air aspiration approach to remove the hull, which is indigestible to humans. The previous noted research suggest that after dehulling, the oats were dried and roasted in a skillet at 115 ± 2°C for two to three minutes in order to produce flavor, deactivate microorganisms, and shorten shelf life in order to prevent food spoiling . To make them easier to eat, the roasted oats were then ground in a lab grinder to minimize their particle size. In order to obtain fine particles, the ground oats were sieved through a 250-µm screen. The final product was stored at 4°C in a refrigerator until used for snack bar preparation.
2.3.2 Faba Bean
After the faba bean sample was manually cleaned to get rid of any foreign objects, it was aspirated with air and sieved through different-sized screens to get rid of any remaining particles. The beans were cleaned and then steeped in distilled water at a 1: 5 (w/v) ratio for 24 hours, with two changes of the soaking water. The water was thrown away after the soaking time was over, and the beans' outer peel was taken off. After that, the legumes were dried in an oven set to 50°C for five hours. The beans were dried, then roasted in a skillet, crushed in a blender, then sieved to get uniformly sized pieces. Before being utilized to prepare snack bars, the finished product was kept in a refrigerator at 4°C.
2.3.3. Sunflower Seeds
Sunflower seed was cleaned by using air aspiration and using different size screens which helps for removing foreign and unwanted materials and other particles. After separate impurities, the seed was roasted in a pan and stored at 4°C in a refrigerator until snack bar preparation.
2.3.4. Flaxseeds
Flax seed was cleaned by hand-pickling to remove unwanted solid matter. The cleaned seed was roasted in a pan and milled into fine powder by using grinder. The powder was stored at 4°C in a refrigerator until snack bar preparation.
2.3.5. Rosemary
Fresh rosemary leaves were cleaned and air-dried. The dried leaves were then oven-dried at 50°C for 12 hours and ground into a fine powder. A 10g sample of the dried rosemary powder was weighed and extracted using maceration with 75 mL of 75% ethanol at 40°C for 8 hours. The extract was collected and concentrated under reduced pressure in a rotary vacuum evaporator until a semi-solid mass was obtained. The semi-solid mass was oven-dried at 50°C overnight to yield a dried extract. The dried extract was then reconstituted with ethanol to obtain a 5% solution and stored at 4°C in a refrigerator until used for snack bar preparation .
2.4. Formulation of Snack Bar by Blending of Raw Materials
The proportion of raw materials was selected according to WHO maximum cereal, legume and oil seeds for snack bars formulation for school children are ranged (shown in Table 1) as, oats: 40 - 50 g, faba bean: 30 - 40 g, sunflower seed: 4 - 10 g, flax seed: 4 - 10 g with constant amount of jaggery (30 g) and rosemary leaf extract (1 g). The composite flour were formulated (shown in Table 2) using central composite mixture design (extreme vertices) by employing Minitab software (v.18, USA). The software has provided 17 experimental runs which have different compositions that help to select the best optimum compositions through its food quality parameters (proximate and mineral food components).
Table 1. Food components and their amount for formulation of the developed snack bar.

Components of the Design

Type

Range of Levels

Low

High

Oat (g)

Randomized

40

50

Faba bean (g)

Randomized

30

40

Sun flower (g)

Randomized

4

10

Flex-seed (g)

Randomized

4

10

The preparations of the snack bars were performed with the total weight (100 g) of the each formulations (Table 2) was homogenized; uniformly spread on rectangular pan and made as snack bar with the approximate thickness of 2 cm. The bars were then allowed to cool for 30 minutes. The developed snack bars were packed in polyethylene bags, labeled, and stored at room temperature.
Table 1. Mixture design for formulation of snack bar.

Run Order

Oats

Faba bean

Sun flower seeds

Jaggery

Rosemary leaf extract

1

46

40

10

30

1

2

50

36

10

30

1

3

46

40

4

30

1

4

40

40

10

30

1

5

47.75

37.75

7.25

30

1

6

48.875

33.875

8.625

30

1

7

50

40

4

30

1

8

50

36

4

30

1

9

48.875

38.875

6.625

30

1

10

46.875

38.875

5.625

30

1

11

48.875

36.875

8.625

30

1

12

50

30

10

30

1

13

48.875

38.875

5.625

30

1

14

46.875

38.875

8.625

30

1

15

48.875

36.875

5.625

30

1

16

50

40

6

30

1

17

43.875

38.875

8.625

30

1

[40-50]

[30-40]

[4-10]

[30gm]

[1]

Note: the proportion of raw materials (oats 40 - 50), (faba beans 30 - 40), (sunflower seeds 4 -10), (flax seeds 4 -10), constant amount of jaggary 30 gm. and rosemary 1gm (act as antioxidant). The summation of oat, faba beans, and sun flowers and flax seeds is 100%, the remaining jaggery (up to 30% of total product weight) to act as sticky-agent for all cases.
2.5. Proximate Compositional Analysis of Raw Materials and Developed Snack Bar
The proximate (crude protein, crude fat, crude fiber, moisture content, ash content, carbohydrate and total energy) analysis of the developed snack bar were determined according to AOAC methods. The essential minerals (iron, zinc, copper, manganese, calcium, potassium, and magnesium) were determined using Atomic Absorption Spectrophotometer .
2.6. Crude Protein
Crude protein was determined using the Kjeldahl method as described by the AOAC . Approximately 1g of the sample was weighed accurately and transferred into a digestion tube. To the digestion flask, 5 mL of an acid mixture (5: 100 ratio of concentrated orthophosphoric acid and sulfuric acid) and 1g of catalyst (a mixture of 0.5g CuSO₄ and 1g K₂SO₄) were added. The digester temperature was set at 370°C until a clear solution was obtained, indicating complete digestion (a clear solution free of undigested material).
Next, 50 mL of distilled water was added and mixed well to prevent precipitation of sulfate. Each digested sample was distilled by adding 50 mL of 40% NaOH to the digestion flask and 25 mL of 4% boric acid, along with three drops of a mixed indicator solution, in the receiving flask. As distillation proceeded, the pink color of the receiving flask changed to green, indicating the presence of ammonia. The distillate was then titrated with 0.1 N HCl to neutralize the liberated ammonia. The volume of HCl required to neutralize the ammonia was recorded. A blank sample was analyzed alongside the test sample, and the volume of acid used to neutralize the blank was also recorded.
The percentage of nitrogen was calculated as follows .
Calculation:
%N=volme of sample-volume blank *N of acid*1.4007)Weight of sample
% Crude protein =Total Nitrogen*6.25
2.7. Crude Fiber
The fiber content was determined according to the AOAC method . A 3g sample was placed into a 500 mL beaker, and 150 mL of 1.25 N H₂SO₄ was added. The mixture was boiled for 30 minutes, maintaining the liquid level by adding hot distilled water. After 30 minutes, 150 mL of 1.25 N potassium hydroxide solution was added to each beaker, and the mixture was boiled for another 30 minutes, again keeping the level constant with hot distilled water. The solution in each beaker was then filtered through filter paper.
The residue was transferred to a crucible, which was dried at 105°C for 3 hours. Afterward, the sample was ashed at 550°C in a muffle furnace for 4 hours, and the mass of the ash was recorded. The final mass of the crucible with the sample was weighed (W2). The crude fiber content was then calculated using the following equation .
%CF=w2-w1w3*100
Where: - W1= Mass of crucible and sample after ash
W2= Mass of crucible and sample after drying in oven
W3= Sample weight
2.8. Crud Fat
The crude fat content of the sample was determined using the Soxhlet method, according to AOAC procedures. Approximately 5g of the sample was weighed and placed into a thimble. A 500 mL round-bottom flask was filled with 300 mL of petroleum ether. The Soxhlet apparatus was then set up, and extraction was performed by refluxing for 8 hours. The petroleum ether was subsequently recovered using a rotary evaporator, and the mass of the crude extract in the flask was recorded. Finally, the content was weighed, and the crude fat was calculated using the following formula .
Fat content%=weight of flask and extracted fat-weight of empty flaskWeight of dried sample X100
2.9. Moisture Content
The moisture content of the samples was determined using the oven method as described by the AOAC. A petri dish was dried at 130 ± 3°C for 1 hour, then placed in a desiccator and weighed after cooling. The mass of the dish was recorded. Approximately 3g of the sample was weighed and placed in the dry petri dish. The dish with its contents was then placed in the oven, maintained at 105°C for 12 hours, and allowed to cool to room temperature. The loss in weight was calculated as a percentage and expressed as moisture content .
Moisture content %=w2-w3w1*100
Where: - W1=, initial mas of sample
W2 = weight of sample with dish before drying
W3= Weight of sample with dish after drying
2.10. Ash Content
The total ash includes an Inorganic left over that remains after the burning and represents the total mineral content of the sample. The ash content was determined using the furnance as described the method by AOAC. An empty crucible is taken and weighed first as W1. 5g of sample was weighed and put on empty crucible. Then, the sample with the crucible was placed in a muffle furnace at 6000 C for 6 hours and finally cooled and weighed .
% Ash content=W3-W1W2-W1×100
Where, W1 - weight of crucible; W2 - weight of crucible with sample before heating; W3 - weight of crucible with ash
2.11. Carbohydrate Content
The total carbohydrate content of each sample was determined by subtraction of the tested parameters from 100% using the following formula .
Edible carbohydrates %=100-(Protein%+fiber%+fat%+ash%+moisture%)
2.12. Total Energy
Energy value was determined by using values of crude protein, crude fat and total carbohydrate content of sample and considering that 1 g of protein yields 4 Kcal energy, 1 g of fat yields 9 Kcal energy and 1 g carbohydrates yields 4 Kcal energy. The gross energy value of the foods was estimated in Kcal/g by multiplying the percentage of crude protein, fiber, carbohydrate and crude fat by the recommended factors of 4, 4, 4, and 9, respectively using the following formula .
The equation is
Total energy=4 Protein+carbohydrates+fiber4+(9 x Fat content)
2.13. Determination of Mineral Elements (Na, K, Ca, Cu, Zn, Mg and Fe)
Digestions of samples: Sample preparation was performed based on the method outlined by AOAC . One gram of each developed snack bar was accurately weighed on an electronic balance and digested with a mixture of 5mL of 65% nitric acid and 5mL of per-chloric acid. The digestion process continued with the addition of hydrogen peroxide, and the sample was removed from the hotplate once a clear solution appeared. Then, 5mL of distilled water was added to the sample and poured into a 25mL volumetric flask. To reduce matrix effects on mineral determination, 2.5mL of 10% lanthanum chloride (LaCl₃) solution was added to the digested sample, and the flask was filled with deionized water up to the mark .
For standard preparations, an intermediate standard solution (100 mg/L) of each metal was prepared from stock standard solutions containing 1000 mg/L. By dilution, more than five series of standards were prepared for each metal, depending on their instrumental detection limits. The absorption of minerals (iron (Fe), zinc (Zn), copper (Cu), potassium (K), sodium (Na), magnesium (Mg), and calcium (Ca)) was analyzed using atomic absorption spectroscopy at their specific wavelengths in the deuterium lamp . Each mineral’s absorbance was measured and determined according to its standard. Each sample was analyzed in triplicates, and the concentration of each metal was calculated using the formula described by Abelti (2017) .
Metal contentmg100g=AVDf10W
Where: W: Weight of the sample (g), V: Volume of the extract (mL), A: Concentration (mg/L) of sample solution, and Df is dilution factors.
2.14. Determination of Antioxidant Activity (DPPH Scavenging Assay)
DPPH solution 0.2M was prepared by dissolving 1.8 mg of DPPH (2, 2-diphenyl-1-picrylhydrazyl) in 15 mL of ethanol. The working sequence was carried out by pipetting 2.5 mL of the extract with different concentrations (0.065, 0.26, 0.52, 0.78 and 1mg/mL) mixed with 2.5 mL of DPPH solution. After 20 min of incubation in dark, the reading of scavenging effect was measured using UV/vis spectrophotometer at 517nm. The DPPH scavenging activity was calculated using the following equation: .
DPPH Radical scavenging% =Abs control -Abs sampleAbs control*100
Where: Abs control = Absorbance of DPPH + absolute ethanol
Abs sample = Absorbance of DPPH radical + sample or standard
2.15. Microbial Analysis of the Developed Snack Bar
Sample preparation A 25 g of snack bar samples was suspended in 0.1% of 225 ml of buffered peptone water (BPW), and homogenized in Erlenmeyer flasks for 5min using shaker at 160 rpm. A 1 ml of homogenized sample was transferred into 9 ml of BPW, and mixed thoroughly by using vortex mixer. The homogenized food sample was serially diluted from 10-1 to 10-6 and 1 ml aliquot of appropriate dilution was plated on pre-solidified plates and incubated at appropriate temperature and period. APC agar preparation: 17.5 grams of APC agar was measured and dissolved in 1000mL of distilled water. Potato Dextrose Agar (PDA) preparation: Commercial PDA powder was dissolved into 1 liter of distilled water by measuring 39g of powder. For complete dissolving the mixture was boiled followed by shaking with a hand and autoclaved 15 minutes at 121°C .
2.15.1. Aerobic Plate Count (APC) Analysis
Take 1mL of solutions in each test tube and added to six different Petri-dishs. From appropriate serial dilutions, 20mL of APC agar was added and shaken slowly. After cooling put into 30°C in an incubator for 72 hours. After 3 days count the colony and CFU/g were calculated and compared with standards .
CFUg=No. of colonies ×Dilution factorvolume ofsample used
2.15.2. Total Fungal Count
Take 0.1 Milliliter of each dilution was plated in triplicate on potato dextrose agar (PDA) supplemented with streptomycin to inhibit bacterial growth. Plates were incubated at 25°C and examined daily for 5 days. The number of all fungal colonies appearing in the three plates was taken as the average number of colonies per plate for the snack bar sample .
2.16. Data Analysis
The data were analyzed using Analysis of variance (ANOVA) and statistical analyses carried out using the statistical software, Minitab (version 18, USA) was used to formulate seventeen formulations to form snack bar from four raw materials . All data were presented as Mean ± standard deviation. Differences were considered statistically significant at p ≤0.05.
3. Results and Discussions
In the present study, the snack bars were made from different ratios of oats, faba-bean, flax seed, and sun flower seed. The Rosemary leaf extract was used in snack bar to improve its anti-oxidant activities and jaggery was used as sweetner. The proximate and mineral compositions of raw materials were discussed. Also, for developed snack bar proximate, macro and micro minerals, anti-oxidants and microbial analysis were studied and discussed as shown following sections.
3.1. Proximate Composition of Raw Material
Determination of the proximate composition is important for identifying the acceptance of the food products. The chemical composition of the selected raw materials oats, faba bean, sunflower seed, and flax seed used for the formulation of the snack bar was studied (Table 3).
Table 3. Proximate compositional values of raw materials.

Component

% Moisture

% Ash

% Fat

% Fiber

% Protein

% CHO

Energy (kcal/100 g)

Oats

4.20±0.50c

2.80±0.04b

5.33±0.27c

8.72±0.25b

13.19±0.4d

65.76±0.28b

398.65±0.74c

Faba beans

6.90±0.09b

2.99±0.2b

3.30±0.08d

1.66±0.02c

39.72±0.06a

45.4±0.90c

397.9±2.20c

Sun flower seeds

10.70±0.06a

4.01±0.03a

10.87±0.06b

11.16±0.2a

26.7±0.3c

40.55±0.79d

411.47±0.36b

Flax seeds

6.30±0.07b

2.14±0.04c

16.02±0.8a

8.20±0.7b

22.17±0.4b

45.17±0.90c

446.16±0.47a

Jaggery

3.88±0.10d

0.56±0.01d

0.12±0.01e

0.00±0.00d

0.32±0.03e

95.12±0.09a

382.86±0.38d

Note: Results are mean ± standard deviations of triplicate determinations; CHO = carbohydrates
3.2. Proximate Composition of Formulated Snack Bar
Determining the proximate composition is important for identifying and acceptance of food products. The result of proximate compositions (moisture, protein, fiber, fat, ash and carbohydrate content) of the developed snack bars was presented in Table 4. In general there is a significant difference (p≤0.05) in fat, protein, ash, carbohydrate content, and fiber content of the snack bar from Table 4.
Table 4. Results of proximate compositions of formulated snack bars.

S.code

% Moisture

% Ash

% Fiber

% Fat

% Protein

% Carbohydrates

Energy (kcal/100 g)

R1

7.63±0.76a

1.17±0.15e

2.99±0.17c

5.65±0.28bcdef

24.19±0.35a

58.38±0.37cd

393.05±2.51abcd

R2

7.33±0.45a

1.12±0.13e

3.02±0.09b

6.57±0.28ab

22.14±0.33bcd

59.83±0.35cd

399.07±2.65abc

R3

8.04±1.44a

2.37±0.07b

3.32±0.24ab

5.09±0.03f

22.99±0.53ab

58.23±1.7d

383.79±5.35d

R4

7.15±0.40a

1.46±0.07de

3.31±0.11ab

7.00±0.31a

22.83±0.57ab

58.24±0.48d

400.58±1.25ab

R5

6.81±0.13a

1.32±0.27e

3.33±0.07ab

6.57±0.19ab

21.65±0.46bcde

60.32±0.77abcd

400.3±0.93ab

R6

6.85±0.17a

1.32±0.25e

3.42±0.12ab

6.88±0.04a

20.59±0.4de

60.9±0.73abc

401.73±1.69a

R7

6.61±0.14a

1.16±0.13e

3.20±0.07ab

5.37±0.12def

21.00±1.03cde

62.66±1.14a

395.80±1.24abc

R8

6.29±0.05a

1.67±1.07cd

3.51±0.31a

5.62±0.24bcdef

20.42±0.28e

62.49±1.20ab

396.29±4.93abc

R9

6.45±0.31a

2.36±0.11b

3.32±0.16ab

5.54±0.44cdef

22.38±0.43bc

59.95±0.07bcd

392.43±2.46bcd

R10

6.45±0.57a

1.87±0.48c

3.44±0.18ab

5.33±0.12def

23.10±0.54ab

59.81±0.99cd

393.37±3.52abc

R11

6.80±0.30a

1.43±0.68de

3.34±0.26ab

6.09±0.34abcde

22.17±0.99bcd

60.16±0.35abcd

397.52±2.19abc

R12

6.66±0.34a

1.68±0.45cd

3.42±0.17ab

6.65±0.53a

21.70±0.32bcde

59.88±0.39cd

399.89±4.73abc

R13

7.22±0.38a

1.37±0.06de

3.19±0.12ab

6.11±0.58abcde

22.02±0.56bcde

60.08±0.53bcd

396.19±4.34abc

R14

7.29±0.15a

1.59±0.59d

3.13±0.07ab

5.28±0.21ef

23.24±0.38ab

59.48±0.97cd

390.88±0.87cd

R15

7.72±0.11a

3.48±0.08a

3.48±0.08ab

6.47±0.23abc

22.24±0.5bcd

58.06±0.83d

393.37±2.86abc

R16

7.32±0.25a

3.09±0.09ab

3.09±0.09ab

5.48±0.59cdef

22.49±0.3bc

60.49±0.92abcd

393.53±3.19abc

R17

6.96±0.07a

3.25±0.16a

3.25±0.16ab

6.32±0.24abcd

23.12±0.6ab

58.81±0.97cd

397.59±1.14abc

Oats: Faba beans: Sun flower seeds: Flax seeds respectively
(R1=46,40,10,4), (R2=50,36,10,4), (R3=46,40,4,10), (R4=40,40,10,10), (R5=47.75, 37.75, 7.25,7.25), (R6=48.875, 33.875, 8.6258.625), (R7=50,40,4,6), (R8=50,36,4,6), (R9=48.875, 38.875, 6.625, 5.625), (R10=48.875, 38.875, 5.625, 8.6250),(R11=48.875, 48.875, 8.625, 5.625),(R12=50,30,10,10), (R13=48.875,38.87, 5.625, 6.625), (R14=46.875, 38.875, 8.625, 5.625), (R15=48.875,36.875, 5.625, 8.625), (R16=50,40,4,6), (R17= 43.875, 38.875, 8.625, 8.625).
3.3. Mineral Analysis
Both Macro and micro-elements are essential for the daily human diet due to its involvement for the growth of human health . In the present study four macro-minerals (Na, K, Ca, and Mg) and three micro essential minerals (Cu, Fe, and Zn) for raw materials and developed snack bar were determined and the obtained data presented in Table 5.
Table 5. Results of mineral compositions of formulated snack bars.

S.Code

Fe

Mg

Ca

K

Na

Cu

Zn

Raw materials:

Oat

11.51±364a

116.6±308c

50.4±0.03c

412.52±0.85b

6.73±0.55c

0.92±0.48b

2.94±0.13c

Faba Bean

2.8±0.02abc

149.7±0.111a

78.32±0.98b

446.81±0.85a

6.47±0.85c

0.30±0.85e

2.72±0.85c

Sunflower seed

5.5±0.01c

117.9±0.12c

43.82±0.33d

239.6±.09c

16.28±0. 80a

1.81±0. 775a

3.78±0.12a

Flax Seed

4.16±0.82ab

131.3±0. 583b

142.16±0.01a

177.7±0.78d

12.41±0. 61b

1.12±0. 68ab

3.22±0.36b

Jaggery

9.24±0.02b

7.88±0.02d

52.46±0.05abc

0.48±0.02e

0.48±0.02e

0.41±0.01f

0.33±0.02d

Formulated snack bars

R1

7.78±0.72de

119.88±1.85abc

5.31±0.21ab

440.6±2.9cde

5.5±0.32defg

0.49±0.06cde

4.71±0.12de

R2

7.93±0.15cd

120.86±0.3 ac

7.21±0.08a

402.18±1.0ab

4.29±0.05i

1.14±0.09a

5.03±0.12a

R3

6.29±0.25f

121.28±0.41a

5.75±0.07ab

390.56±0.9cd

7.72±0.10b

0.66±0.04c

5.18±0.06a

R4

7.5±0.3de

121.09±1.44a

5.60±0.1ab

401.09±1.2a

7.75±0.10a

0.5±0.06cde

5.12±0.11a

R5

7.57±0.26de

120.82±0.3ac

5.62±0.12ab

381.57±1.3cd

4.46±0.07i

0.49±0.06ce

6.22±0.09a

R6

7.9±0.12cde

121.16±0.11a

7.45±0.15a

406.81±1.5a

7.61±0.08a

1.14±0.09a

7.7±0.06cde

R7

8.27±0.12cd

118.18±0.17c

7.87±0.03a

391.92±2.7cd

5.25±0.1fgh

0.64±0.07cd

7.7±0.06cde

R8

8.36±0.04cd

120.8±0.24a

8.1±0.09de

381.84±2.3cd

5.92±0.08c

1.18±0.06a

4.36±0.09de

R9

8.4±0.26cd

120.8±0.196a

5.43±0.05ab

421.24±1.4a

5.5±0.1defg

0.4±0.04cde

5.55±0.32a

R10

8.99±1.19bc

119.9±0.35abc

5.43±0.05ab

398.5±0.63cd

5.7±0.06cd

0.43±0.00e

5.33±0.06a

R11

10.6±0.05a

120.29±0.17a

4.83±0.06de

364.32±1.0cd

5.64±0.1ce

0.43±0.00e

3.65±0.14de

R12

8.2±0.30cde

121.01±0.17ab

8.03±0.08bcd

408.53±1.2ab

5.8±0.08cd

1.29±0.05a

5.16±0.1a

R13

8.5±0.22bcd

119.88±1.85abc

4.58±0.07de

396.8±0.42be

5.6±0.08cef

0.41±0.04de

7.3±0.13cde

R14

8.29±0.03cd

121.13±0.24ab

6.64±0.19bcd

399.2±2.18de

5.13±0.07h

0.43±0.00e

5.72±0.09a

R15

7.05±0.08ef

120.56±0.43a

5.43±0.05ab

408.89±0.8ac

5.2±0.05gh

0.89±0.16b

6.76±0.08a

R16

8.31±0.05cd

119.61±0.36abc

7.799±0.07a

396.55±0.6ad

5.06±0.05h

0.49±0.06ce

7.22±0.21ce

R17

9.62±0.19ab

120.48±0.39a

7.38±0.07a

400.0±1.09aa

5.4±0.07efh

0.5±0.06ce

7.17±0.21ce

Oats: Faba beans: Sun flower seeds: Flax seeds respectively
(R1=46,40,10,4), (R2=50,36,10,4), (R3=46,40,4,10), (R4=40,40,10,10), (R5=47.75, 37.75, 7.25,7.25), (R6=48.875, 33.875, 8.6258.625), (R7=50,40,4,6), (R8=50,36,4,6), (R9=48.875, 38.875, 6.625, 5.625),(R10=48.875, 38.875, 5.625, 8.6250),(R11=48.875, 48.875, 8.625, 5.625),(R12=50,30,10,10), (R13=48.875,38.87, 5.625, 6.625), (R14=46.875, 38.875, 8.625, 5.625), (R15=48.875,36.875, 5.625, 8.625), (R16=50,40,4,6), (R17= 43.875, 38.875, 8.625, 8.625).
3.3.1. Macro Minerals
The developed snack bar macros mineral analyses were are shown in Table 5. From above table potassium (K) >magnesium (Mg) > calcium (Ca) > sodium (Na) in all developed snack bar. Potassium was recorded to be the most dominant element in all the snack bars studied with the mean value ranging from 364.32±3.07-440.6±29.9 mg/100g. As cited by Silva. (2016), produced snack bar from on jerivá flour, and reported the K content that was 183 mg/100g which is lower than the present study. However, Previous research Ho et al., (2022) & Istrati et al., (2019) was reported that the potassium content (964.21 to 1271.11 mg/100 g) which is higher than the present study . The sodium content of the bar was relatively small from the rest of macro minerals and has significant difference with (p≤0.05) (Table 5) between the means of the developed snack bar and ranged 4.29 - 7.75 mg/100 g. The high potassium and low sodium content in the developed snack bar are beneficial for people suffering from hypertension (Syam et al., 2016). The magnesium content of the present study (118.18±0.17-121.28±0.41 mg/100g) was found to be greater than the date based Snack bars which are reported .
Calcium (Ca) is the mineral responsible for the growth and maintenance of bone tissue and has an activating role . As shown in Table 5, the calcium content was recoded as low amount in R13 as 4.58±0.07 mg/100 g and highest in R8 (8.1±0.09 mg/100 g). But from the present study, the calcium content of the developed snack bar was slightly lower than banana flour-based snack bar which is produced by Ho et al.,(2022) & Istrati et al., (2019) reported 8.5-8.8 mg/100 g .
3.3.2. Micro-minerals
Even though micro minerals found in the small amount, the low intakes of these micronutrients could have the deficiency problems (Fe leads to anemia and Zn effects on normal body physiology) which reported earlier . As shown the result present in Table 5 iron is present in higher concentrations whereas zinc and copper are found in low concentrations in all snack bars. Among the snack bar, in Fe content determination there is a significant difference with p≤0.05 (Table 5) between the means and in R17 iron was recorded in highest amount (9.62±0.19 mg/100 g) and in R3 was lowest (6.29±0.25 mg/100 g). Silva et al. (2016), reported that the iron content of jerivá flour supplemented snack bars that were 2.4-3.1 mg/100 g which is lower than the present result . However in the present study, the concentration of Fe is being slightly agreed with WHO recommended levels of Fe in the food that is 10 to 30 mg/100 g limit set by WHO 1982 as described by previous researchers .
Both Zn and Cu are also essential trace minerals. There is a slight significance difference in cupper determination and no more significant difference in zinc content. The value was ranged 0.43-1.29 mg/100 g and 3.65-7.75 mg/100 g for Cu and Zn, respectively, shown in Table 5. According to Silva et al (2016) reports, the Cu and Zn content in the snack bar was 0.1-0.21 mg/100 g and 1.35-1.6 mg/100g, respectively . According to WHO as described by Ofori et al., (2016) and WHO (2005) the safe limit of Cu in food is 0.4 mg/100 g and for Zn was 3-10 mg/100 g thus most of the composite snack bars are within the recommended levels of WHO .
3.4. Antioxidant Components of Rosemary Leaf Extract
Antioxidants can prevent oxidative damage to food during processing, storage and preparation of meals. Crude rosemary leaves extract has total phenol and flavonoids which are the most commonly found phytochemicals .
3.5. Antioxidant Analysis by DPPH (2, 2-Diphenyl-1-Picrylhydrazyl) Assay
Due to the presence of phenolic and flavonoid compound in the rosemary extract can readily undergo decreasing the DPPH radical’s concentration through the subsequent reaction after the addition of extract . The concentrations of the extracts (0.065, 0.28, 0.52, 0.73, 0.95 mg/L) were prepared after the determination of the concentrations of total phenol in relative to gallic acid standards. As shown in Figure 2. The concentration required to inhibit 50% of DPPH radicals (IC50) was subsequently determined the percentage of DPPH inhibition against the rosemary extract concentration.
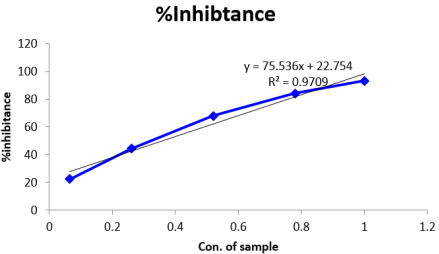
Figure 2. Antioxidant activities of crud rosemary leaf extract on DPPH.
As shown in table below, the IC50 value of the present study was 0.36mg/L which was slightly lower than an1 report that was 0.532mg/mL . Also Saini et al. (2020) reported that IC50 values in the rosemary leaf extract that was 40.76±2.81µg/mL which slightly lower than the present result .
Table 6. Antioxidant activities of rosemary.

Parameter

Amount

TPC

135.83±3.38 mg GAC/g

TFC

31.52±0.28 mg que/g

% IC50

1.36 mg/Ml

3.6. Optimization of Formulated Snack Bar Using Regression Mixture Analysis
3.6.1. Regression Mixture Analysis
Mixture regression with full quartic analysis was used to generate polynomial models for the response variables . All the response parameters proximate compositions (moisture, ash, protein, fat, fiber, carbohydrates, and gross energy), minerals and sensory of the developed snack bar were analyzed by feeding the data in Minitab software version 18.1 The best fitting model was verified according to the model significance, lack of fit, multiple correlation coefficients (R2) (Predicted R2 (R-sq (pred)), adjusted R2 (R-sq (adj)), and R2 (R-sq)) that are used to determine how well the model fits the data, examine the goodness-of-fit statistics in the Model Summary table (see table 7). According to a previous study, the determination coefficient should be at least 60% to obtain the best fit model . This is desirable as it demonstrates that there is an interaction among the factors of the model has a significant effect on the response. Therefore, in this model all R2 values were > 90% which are used to predict in this study (see Table 8).
These statistical significance of the terms in the regression mixture was examined using ANOVA for each response at p<0.05. If the p≤ 0.05 and large F-value indicates more difference between the groups greater or the interaction can be considered as statistically significance. The p-values of proximate composition and minerals in mixture regression summarized in the following Table 7.
Table 7. P-values of full quartic regression model for mixtures in different parameters.

Proximate compositions

Source

Ash

Moisture

Fiber

Fat

Protein

Carbohydrate

Energy

Regression

0.000

0.000

0.000

0.000

0.000

0.000

0.000

Linear

0.001

0.000

0.716

0.774

0.999

0.000

0.000

Quadratic

0.002

0.049

0.041

0.034

0.000

0.000

0.000

oat*fababean

0.079

0.915

0.742

0.332

0.938

0.015

0.000

oat*sun flower

0.046

0.915

0.725

0.001

0.009

0.023

0.000

oat*flaxseed

0.128

0.653

0.498

0.004

0.021

0.003

0.000

fababean*sun flower

0.000

0.018

0.105

0.000

0.009

0.000

0.001

fababean*flexseed

0.008

0.054

0.552

0.000

0.003

0.657

0.000

Special Quartic

0.009

0.528

0.048

0.027

0.002

0.003

0.000

oat*fababean*sun flower*flaxseed

0.009

0.528

0.048

0.027

0.002

0.003

0.000

R2 (Adjusted)

0.96

0.93

0.91

0.98

0.98

0.85

0.85

Table 8. P-values of full quartic regression model for mixtures for Minerals.

Source

K

Na

Mg

Ca

Fe

Cu

Zn

Regression

0.000

0.000

0.000

0.000

0.000

0.000

0.000

Linear

0.614

0.997

0.509

0.731

0.003

0.008

0.004

Quadratic

0.000

0.009

0.012

0.000

0.000

0.000

0.000

oat*fababean

0.456

0.873

0.967

0.704

0.718

0.016

0.164

oat*sun flower

0.553

0.841

0.877

0.760

0.710

0.006

0.005

oat*flaxseed

0.464

0.889

0.927

0.041

0.004

0.007

0.335

fababean*sun flower

0.005

0.006

0.004

0.001

0.021

0.007

0.041

fababean*flaxseed

0.127

0.966

0.832

0.030

0.009

0.003

0.744

Special Quartic

0.006

0.004

0.007

0.005

0.012

0.008

0.005

oat*fababean*sun flower*flaxseed

0.006

0.004

0.007

0.005

0.012

0.008

0.005

R2(Adjusted)

0.99

0.97

0.94

0.99

0.98

0.95

0.98

3.6.2. Effects of Food Component on Response Parameters
As shown in Table 7, the responses are statistically significant to resolve optimization, in the proximate composition and minerals in a full quadratic regression model have statistically significant relationship with p≤0.05.
As shown figure 3, the individual contour plot shows that the effects of components (oat, faba-bean, sun flower, and flax-seed) on response parameters (on proximate and mineral content). Briefly, as the amount of the food component changes, the fat, protein, ash, carbohydrate, and energy values significantly changed. The individual contour plots display the effect of raw materials on each response parameters.
For example, the contours plots for ash indicated that the maximum ash content was achieved for 40 - 46% oats, 30-35% faba bean, 4-8% sunflower and flaxseed. Similar trend has been observed for all the responses in the individual contour plots depicted below.
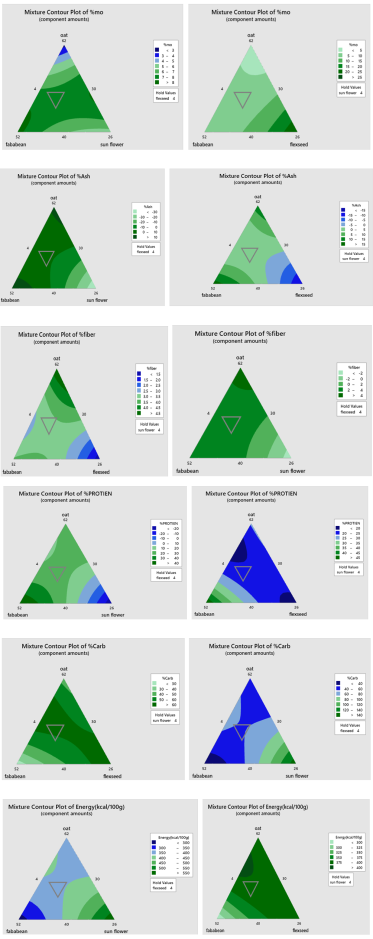
Figure 3. Individual contour plots of proximate composition.
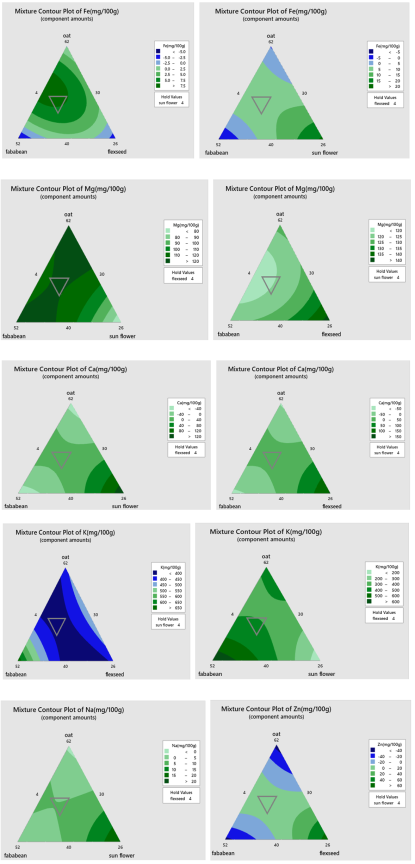
Figure 4. Individual contour plots of minerals (Na, K, Mg, Ca, Fe, Cu, and Zn).
3.6.3. Response Optimization of Snack Bar Using Overlaid Contour Plots and D-optimizer
Primary objective of this study is to develop snack bar having high qualities with regard to its fiber, protein, fats, carbohydrates, and minerals values. The optimum combinations of the components in the snack bar formulation were determined to produce the most acceptable product with the maximum response value (high fiber, protein, fats, carbohydrates, and minerals). In overlaid contour plot the ‘white spot’ that optimizes the responses was determined using the lower and upper goals for response which were defined by the researchers . The white spot in the figure below shows the feasible area that is the optimum component of the mixture or optimized the response variables listed in the respective legends.
The Minitab software gives the predicted response values for different parameters. From the graphical and numerical optimization results, one composite ratio was selected based nutritional values of the developed snack bar. In the graphical representation that is the white spot area can get Oat (48 g), Faba bean (39 g), Sunflower (4 g), and Flaxseed (8 g) compositions that have maximum response values. Whereas based on numerical optimizations oat (48.1820 g), faba-bean (39.8050 g), sun flower (4 g), and flex-seed (8.01304 g) with Composite Desirability of 0.940494 was selected as the optimized result that is slightly agreed with the graphical value.
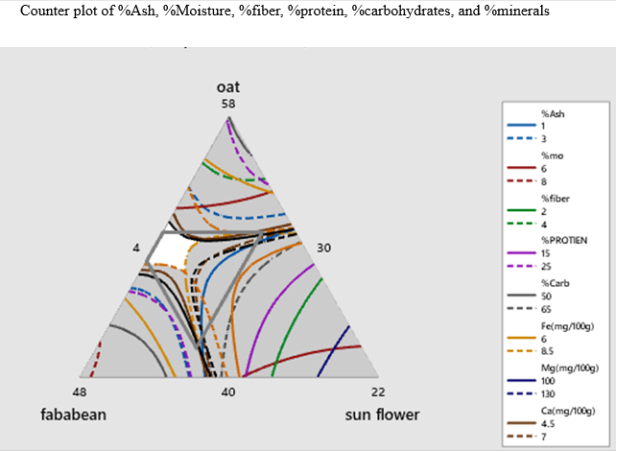
Figure 5. Overlaid contour plots of proximate compositions and minerals (Fe, Mg, and Ca,).
Based on the different input of responses three best food component mixtures were selected with good composite desirability (shown in Table 9) that reaches (nearby one). All of these three food mixtures with 1g (constant) of rosemary leaf extract and without rosemary (taken as control); those total four types of snack bar were formulated. Based on these recipes that were obtained using D-optimizer approach (Minitab software, v.18, USA) as the best solutions (Samples: OR1, OR2 and OR3), and prepared the nutritious snack bars, and all the predicted response values of the final products were analyzed and compared with the experimental values of each response. It indicates that the predicted responses are well agreed with the experimental values (as shown in Table 9).
Table 9. Theoretical and Experimental response values (mean±sd) of the selected composite food samples.

S.code

Response parameters

Theoretical value

Experimental value

OR1

Oat = 48 g

Faba bean = 39 g

Sunflower = 4 g,

Flaxseed = 8 g

% Ash

1.172

1.69±0.25

% Protein

24.940

22.57±0.39

% Carbohydrates

59.841

60.57±2.3

Energy (kcal/

391.206

400.67±5.9

Fe (mg/100 g)

7.809

7.52±0.51

Mg (mg/100 g)

119.202

120.22±0.99

Ca (mg/100 g)

5.996

5.26±0.50

K (mg/100 g)

392.013

390.78±3.24

Na (mg/100 g)

5.779

6.13±0.67

Zn (mg/100 g)

6.328

6.02±0.38

Composite desirability: 0.94049

S.code

Response parameters

Theoretical value

Experimental value

OR2

oat=47.7803

faba-bean= 39.854

sun flower=7.8501

flex-seed=4.5154

% Ash

2.426

2.44±0.25

% Protein

23.914

23.65±0.29

% Carbohydrates

65.546

67.12±0.69

Energy (kcal/

398.206

400.67±5.9

Fe (mg/100 g)

7.909

7.52±0.51

Mg (mg/100 g)

120.202

121.22±0.99

Ca (mg/100 g)

6.596

5.26±0.50

K (mg/100 g)

398.013

400.78±3.24

Na (mg/100 g)

6.779

6.13±0.67

Zn (mg/100 g)

7.328

6.72±0.38

Composite desirability: 0.90412

S.code

Response parameters

Theoretical value

Experimental value

OR3

Oat= 50

Faba-bean= 30

sun flower= 10

flex-seed= 10

% Ash

1.172

1.69±0.25

% Protein

24.940

22.57±0.39

% Carbohydrates

59.841

60.57±2.3

Energy (kcal/

391.206

400.67±5.9

Fe (mg/100 g)

7.925

7.88±27

Mg (mg/100 g)

120.993

122±4.25

Ca (mg/100 g)

7.883

8.02±0.63

K (mg/100 g)

412.200

415.21±5.23

Na (mg/100 g)

6.102

6.51±0.38

Cu (mg/100 g)

1.294

1.33±0.45

Composite desirability: 0.93982

3.7. Microbiological Analysis
Among the varieties of the processed Snack bars cereal based packaged snack bar (currently studied) is one of the ready-to-eat (RTE) foods. The microbial count of snack bars is crucial to determine the microbial activity and it is an important attribute to any food product for its shelf stability. Therefore; the shelf life stability is assessed based on microbial load analysis .
Table 10. Aerobic plate count (APC) of developed snack bar for 30 days at 25°C.

Aerobic plate count (APC) in CFU/g during 30days of storage

S.code

0day

7day

15day

30day

Control

TFTC

1.45×10⁴

6.00×10⁶a

3.38×10⁸a

OR1

TFTC

TFTC

1.45×10⁵b

2.26×10⁵c

OR2

TFTC

TFTC

4.95×10³d

1.43×10⁶b

OR3

TFTC

TFTC

5.95×10⁴c

1.32×10⁵c

OR1 (Oat =48g, Faba bean =39g, Sunflower =4g, Flaxseed =8g and 1g rosemary); OR2 (oat=47.7803, faba-bean= 39.854, sun flower=7.8501, flex-seed=4.5154; and 1g rosemary) OR3 (Oat= 50, Faba-bean= 30, sun flower= 10g, flex-seed= 10g, 1g rosemary) and control (Oat =48g, Faba bean =39g, Sunflower =4g and Flaxseed =8g without rosemary)
Table 11. Total fungus count (TFC) of developed snack bar for 30 days at 25°C.

Total fungus count (TFC) in cfu/g during 30 days of storage

S.code

0day

7day

15day

30day

Control

TFTC

3.1×10⁶

2.2×10⁷a

2.85×10⁸a

OR1

TFTC

TFTC

2.85×10³b

2.52×10⁵c

OR2

TFTC

TFTC

3.40×10²c

8.40×10⁵c

OR3

TFTC

TFTC

1.55×10³b

6.55×10⁶b

OR1 (Oat =48g, Faba bean =39g, Sunflower =4g, Flaxseed =8g and 1g rosemary); OR2 (oat=47.7803, faba-bean= 39.854, sun flower=7.8501, flex-seed=4.5154; and 1g rosemary) OR3 (Oat= 50, Faba-bean= 30, sun flower= 10g, flex-seed= 10g, 1g rosemary) and control (Oat =48g, Faba bean =39g, Sunflower =4g and Flaxseed =8g without rosemary).
The shelf life study of the developed snack bar was carried out by assessing total colony count and total fungus (yeast and mould) for 30 days of storage at room temperature. As shown in Tables 10 and 11, in both total microbial load and total fungus were not observed /or counted for zero day and at 7 days of storage in all snack bar samples. However, initially 1.45×10⁴ Aerobic plate count (APC) and 3.1×10⁶ cfu/g total fungus, respectively was observed in control snack bar (bar without rosemary) and it increased rapidly after 30 days of storage. Table 11 and 12 shows the microbial load (Total plate count and total fungus) of developed snack bar samples during storage at 25°C for 30 days and the number of colonies increased slightly over a period of 30 days.
But in the snack bar without rosemary (control) the microbial count increased rapidly and reached to high levels during 30 days storage period. This is may be due absence of rosemary (which have good total phenolic content and antioxidant activity) in the snack bar samples. The microbiological quality of this developed snack bar samples were compared with guidelines for the microbiological quality of ready to eat foods published by the Central Public Health Laboratory Services (PHLS). According to this guidelines, different ready to eat snack foods the total bacterial count and total fungus should be less than 1x10⁵ cfu/g for good quality (accepted) and the total bacterial count and total fungus ≤ 1x10⁶ is satisfactory or nearly not accepted and not safe for human consumption. Therefore, according to Public Health Laboratory Services (PHLS) and International Commission for Microbiological Specifications of ready-to-eat Foods, all developed packed snack bars containing rosemary were safe for human consumption until 30 days of storage at 25°C .
3.8. Sensory Evaluations of Snack Bar
In this study the results of sensory evaluation in terms of sensory characteristics such as color/appearance, taste, aroma, texture and overall acceptability of composite bread were presented in Table 12.
Table 12. Sensory evaluation of the developed snack bar.

S. code

Color

Flavor

Taste

Texture

Overall-acceptability

Control

5.31±0.7c

5.44±0.51b

4.94±0.93c

5.69±0.7c

5.34±0.38b

OR1

6.3±0.6a

6.4±0.85a

6.19±0.75a

6.37±0.5a

6.2±0.44a

OR2

5.9±0.82b

5.78±0.6b

5.69±0.7b

6.12±0.72a

5.87±0.39b

OR3

6.12±0.72a

6.1±0.62a

6.3±0.6a

6.06±0.68b

6.14±0.3a

OR1 (Oat =48g, Faba bean =39g, Sunflower =4g, Flaxseed =8g and 1g rosemary); OR2 (oat=47.7803, faba-bean= 39.854, sun flower=7.8501, flex-seed=4.5154; and 1g rosemary) OR3 (Oat= 50, Faba-bean= 30, sun flower= 10g, flex-seed= 10g, 1g rosemary) and control (Oat =48g, Faba bean =39g, Sunflower =4g and Flaxseed =8g without rosemary)
Taste /mouth feel and flavor of the food are the main parameters and they are good indicators in analyzing sensory characteristics. Whether the product fulfills the entire nutrient requirement without good taste/mouth feel and flavor/aroma of food is not acceptable. There is a significance difference with p≤0.05 between the means of the control sample (snack bar without rosemary powder) and the rest of samples mainly by their flavor and overall acceptability. All the developed snack bar that have rosemary powder had good flavor, taste, and overall acceptability but OR1 have relatively high aroma/smell (6.4±0.85) and overall acceptability (6.2±0.44a) value this indicated that OR1 is more suitable for good aroma and other overall acceptability the snack bar. Generally, all the prepared snack bars were accepted by the untrained/or semi-trained members of panelist for color, texture, taste (mouth feel) and flavor (aroma).
4. Conclusions
In the present study, snack bar was successfully developed and formulated from commonly available raw materials like oats, sun flower seeds, flaxseeds, faba beans and rosemary. The snack bar combination was optimized through the regression mixture design using (Minitab) software and it was identified that the ratio of Oats (48g), Faba beans (39g), Sunflower (4g), and Flaxseeds (8g) had good nutritional composition and high desirability value. The proximate analysis showed that the developed snack bar had good amount of carbohydrates, protein and minerals. In this study, crude rosemary extract has been incorporated in the snack bar which improved its sensory and shelf life. The sensory evaluation has revealed that OR1 has the highest overall acceptability and other snack bars were also found to be acceptable by the panelists. The shelf life of the developed products (Snack bar) was carried out and it was identified that the snack bars were found to be safe for consumption until 30 days of storage.
Abbreviations

Abbreviation

Full Term

ANOVA

Analysis of Variance

ANFs

Anti-nutritional Factors

AOAC

Association of Official Analytical Chemists

APC

Aerobic Plate Count

AAS

Atomic Absorption Spectrophotometer

APC

Aerobic Plate Count

BPW

Buffered Peptone Water

CFU/g

Colony-Forming Units per Gram

DPPH

2,2-Diphenyl-1-picrylhydrazyl

IC₅₀

Inhibitory Concentration Required to Reduce 50% of Radicals

ICMSF

International Commission on Microbiological Specifications for Foods

G6PD

Glucose-6-Phosphate Dehydrogenase

LDL

Low-Density Lipoprotein

LaCl₃

Lanthanum Chloride

Mg

Magnesium

PDA

Potato Dextrose Agar

PHLS

Public Health Laboratory Services

RPM

Revolutions Per Minute

TPC

Total Phenolic Content

TFC

Total Flavonoid Content

WHO

World Health Organization

RTE

Ready-to-Eat (Foods)

GAC

Gallic Acid Content

que

Quercetin Equivalent

CHO

Carbohydrates

R1-R17, OR1-OR3

Snack Bar Formulations (Coded Samples)

Author Contributions
Gemechu Duguma Argessa is the sole author. The author read and approved the final manuscript.
Funding
Research has not received any funds from government or non-governmental Institutions.
Availability of Data and Materials
All data generated or analyzed during this study are included in this published article.
Conflicts of Interest
The author declares no conflicts of interest.
References
[1] Ayogu, R. N. B., Afam-Anene, O. C., & Udenta, E. A. (2018). Evaluation of nutrient composition, functional, and sensory properties of complementary food formulated from sorghum, bambara nut, and orange-fleshed sweet potato. Current Research in Nutrition and Food Science Journal, 6(2), 361-372.
[2] Pathare, P. B. (2010). Development of a cereal bar using local ingredients. Asian Journal of Food and Agro-Industry, 3(3), 302-310.
[3] Tekalegn, Y., Abera, A., & Baraki, N. (2021). Prevalence of undernutrition and associated factors among school-age children in Ethiopia. BMC Nutrition, 7, 1-9.
[4] Webster, F. H., & Wood, P. J. (2011). Oats: Chemistry and Technology (2nd ed.). American Association of Cereal Chemists.
[5] Taneyo Saa, D. L. (2014). Oats as functional food: Nutritional and health benefits. African Journal of Food Science and Technology, 5(4), 81-88.
[6] Ali, M., Maalouf, F., Ahmed, S., & Abang, M. M. (2014). Faba bean breeding and production technologies. ICARDA Manual, 15, 1-22.
[7] Rochfort, S., & Panozzo, J. (2007). Phytochemicals for health, the role of pulses. Journal of Agricultural and Food Chemistry, 55(20), 7981-7994.
[8] De Leonardis, A., Macciola, V., & De Felice, M. (2003). Effects of different roasting conditions on the oxidative stability of sunflower seed oil. European Journal of Lipid Science and Technology, 105(3-4), 152-158.
[9] Eyres, L. (2015). The role of herbal extracts in food preservation. Food New Zealand, 15(5), 29-32.
[10] Jethwani, P., Mehta, R., & Kumari, A. (2020). Rosemary extract as a natural antioxidant in food preservation. Journal of Pharmacognosy and Phytochemistry, 9(3), 1876-1880.
[11] Nath, A., Dutta, D., & Kumar, P. (2015). Jaggery: A traditional Indian sweetener. Indian Journal of Traditional Knowledge, 14(3), 532-537.
[12] Sun-Waterhouse, D. (2010). The development of functional foods incorporating ingredients sourced from by-products of fruit industry. Food Research International, 44(5), 1217-1226.
[13] Soni, A., & Saxena, D. C. (2018). Nutritional and sensory evaluation of developed multigrain bars. International Journal of Food and Nutritional Sciences, 7(2), 25-30.
[14] Malik, S., Bhat, M., & Kumar, P. (2019). Nutritional composition of cereals and cereal products. International Journal of Agriculture Sciences, 11(8), 8456-8459.
[15] Gill, R., & Singh, J. (2020). Nutritional quality and consumer acceptability of developed cereal bar. Journal of Pharmacognosy and Phytochemistry, 9(2), 952-956.
[16] Omran, A. A. (2018). Development of cereal bar using selected cereals and pulses. Journal of Food Processing & Technology, 9(6), 1-5.
[17] Margier, M., Leroux, C., Durand, E., Prost, M., Demonty, I., & George, S. (2018). Nutritional composition of legumes: Application to health benefits and understanding metabolism. Journal of Functional Foods, 45, 155-164.
[18] Andrejaš, L., Adžamić, M., & Vukušić, J. (2020). Consumer behavior and snack food consumption trends. Croatian Journal of Food Science and Technology, 12(1), 23-30.
[19] Sobana, A. (2017). Sports nutrition and energy bar formulation. International Journal of Engineering Research and Applications, 7(8), 1-4.
[20] Bigliardi, B., & Galati, F. (2013). Innovation trends in the food industry: The case of functional foods. Trends in Food Science & Technology, 31(2), 118-129.
[21] Granato, D., Branco, G. F., Nazzaro, F., Cruz, A. G., & Faria, J. A. F. (2010). Functional foods and nondairy probiotic food development: Trends, concepts, and products. Comprehensive Reviews in Food Science and Food Safety, 9(3), 292-302.
[22] Bhakha, R., Sharma, S., & Singh, D. (2019). Nutritional evaluation and acceptability of value-added bars developed using cereals, pulses, and dried fruits. International Journal of Chemical Studies, 7(2), 1076-1080.
[23] Mohd Aiman, Y. A., Muhammad, F. A., Wan Abdul Manan, W. M., & Nurul Izzah, A. H. (2016). Nutritional composition and consumer acceptability of cereal snack bars enriched with soy protein isolate and date paste. Malaysian Journal of Nutrition, 22(1), 27-34.
[24] Devi, N., Sarma, D., & Deka, S. C. (2016). Antinutritional factors and bioactive compounds in some indigenous rice varieties of Assam. International Journal of Current Microbiology and Applied Sciences, 5(5), 647-653.
[25] Ranjana, K., Chauhan, B. M., & Saxena, D. C. (2013). Nutritional and anti-nutritional characteristics of faba bean (Vicia faba L.). Journal of Food Science and Technology, 50(1), 44-50.
[26] Rahate, K. A., Madhumita, M., & Kaur, C. (2020). Effects of processing on reduction of anti-nutritional factors in faba bean (Vicia faba L.). Legume Science, 2(4), e42.
[27] Saini, R. K., Nile, S. H., & Keum, Y. S. (2020). Health benefits and functional properties of rosemary (Rosmarinus officinalis) as a food ingredient. Journal of Food Science, 85(8), 2679-2687.
[28] David, P. M., John, A. A., & Williams, O. T. (2015). Standard methods for the determination of mineral elements in food using atomic absorption spectrophotometry. Journal of Food Composition and Analysis, 38, 30-38.
[29] AOAC. (2000). Official Methods of Analysis (17th ed.). Association of Official Analytical Chemists, Gaithersburg, MD, USA.
[30] Ramírez, J. A., García, M. C., & Fernández, A. (2018). Evaluation of the Kjeldahl method for nitrogen determination in food samples: Optimization and quality control. Journal of Food Chemistry, 255, 354-360.
[31] Momanyi, M. K., Omwamba, M. N., & Mbugua, S. K. (2020). Determination of crude fiber content in food samples using standard gravimetric procedures. International Journal of Food Science and Nutrition, 5(3), 45-51.
[32] Desalegn, A., Abera, S., & Tadesse, A. (2015). Determination of crude fat content in food samples using solvent extraction method. International Journal of Food Science and Nutrition Engineering, 5(2), 55-60.
[33] AOAC. (1999). Official Methods of Analysis (16th ed.). Association of Official Analytical Chemists, Washington, DC, USA.
[34] Abbas, S., & Shah, S. H. (2007). Application of lanthanum chloride to minimize interference in atomic absorption spectroscopic determination of mineral elements in food samples. Journal of Analytical Chemistry, 62(3), 248-252.
[35] Kasozi, K. I., Namubiru, S., Kamugisha, R., & Matovu, E. (2018). Evaluation of heavy metal content and mineral composition of selected herbal plants used in traditional medicine in Uganda. Evidence-Based Complementary and Alternative Medicine, 2018, Article ID 7369574.
[36] Abelti, A. L. (2017). Determination of essential and toxic metals in selected cereal grains marketed in Addis Ababa, Ethiopia (Master’s thesis). Addis Ababa University, Addis Ababa, Ethiopia.
[37] Sarwar, A., Wahid, F., Imran, M., & Mehmood, T. (2020). Evaluation of antioxidant activity of plant extracts using DPPH free radical scavenging assay. Journal of Medicinal Plants Studies, 8(2), 50-55.
[38] Demissie, T., Tadesse, A., & Fekadu, H. (2018). Isolation and identification of fungal contaminants from food samples and antimicrobial susceptibility testing. International Journal of Microbiology Research, 10(1), 22-28.
[39] Peltier, D. M., Smith, J. K., & Johnson, R. L. (2015). Statistical methods for food science: Application of ANOVA and experimental design. Journal of Food Science and Technology, 50(3), 450-460.
[40] Ho, J. C., Lee, S. H., & Kim, M. Y. (2022). The importance of macro- and micronutrients in human health: A comprehensive review. Nutrients, 14(4), 789.
[41] Istrati, D., Popescu, D., & Stanciu, G. (2019). Role of essential minerals in human nutrition and health. Journal of Nutritional Biochemistry, 65, 1-12.
[42] Munir, S., Ahmed, I., & Khan, M. A. (2018). Nutritional and mineral composition of date-based snack bars: Implications for functional food development. Journal of Food Science and Technology, 55(6), 2300-2308.
[43] Syam, S., Kumar, P., & Rao, V. (2016). Micronutrient deficiencies and their health impacts: A review. Journal of Nutrition and Health, 7(4), 234-242.
[44] Silva, M. A., Santos, J. D., & Almeida, R. F. (2016). Nutritional characterization of jerivá flour-supplemented snack bars. Food Chemistry, 212, 529-535.
[45] Ofori, J., Agyekum, A., & Mensah, J. (2016). Assessment of iron levels in commonly consumed foods and their compliance with WHO guidelines. Food Safety Journal, 10(2), 78-85.
[46] World Health Organization (WHO). (1982). Trace elements in human nutrition and health (Technical Report Series No. 670). Geneva: WHO.
[47] Skowyra, M., Różańska, M., & Chojnacka, K. (2014). Polyphenols content and antioxidant activity of rosemary (Rosmarinus officinalis L.) extracts. Journal of Food Science and Technology, 51(12), 3703-3711.
[48] Tavassoli, A., & Djomeh, Z. E. (2011). Total phenols, flavonoids, and antioxidant activity of different rosemary extracts. Journal of Medicinal Plants Research, 5(3), 66-71.
[49] Nguyen, V. T., Nguyen, D. H., & Tran, Q. T. (2020). Evaluation of antioxidant activity of plant extracts using DPPH assay: A comparative study. Journal of Applied Pharmaceutical Science, 10(6), 45-51.
[50] Sarifudin, A., Nugraha, R., & Ramadhan, R. (2020). Application of mixture regression models for the optimization of food formulations: A full quartic polynomial approach. International Journal of Food Science and Nutrition, 5(2), 34-42.
[51] Montgomery, D. C. (2013). Design and Analysis of Experiments (8th ed.). John Wiley & Sons.
[52] Akinmoladun, O. F., Akinmoladun, F. O., & Olajide, O. T. (2020). Microbial quality and shelf-life stability of cereal-based snack bars. Journal of Food Science and Technology, 57(5), 1791-1799.
[53] Public Health Laboratory Services. (1998). Guidelines for the microbiological quality of ready-to-eat foods. PHLS Microbiology Digest, 15(1), 1-5.
[54] International Commission on Microbiological Specifications for Foods (ICMSF). (1998). Microorganisms in foods 6: Microbial ecology of food commodities.
Cite This Article
  • APA Style

    Argessa, G. D. (2025). Development and Nutritional Optimization of a Healthy Snack Bar for Children Using Locally Available Ingredients. Science Frontiers, 6(3), 34-56. https://doi.org/10.11648/j.sf.20250603.11

    Copy | Download

    ACS Style

    Argessa, G. D. Development and Nutritional Optimization of a Healthy Snack Bar for Children Using Locally Available Ingredients. Sci. Front. 2025, 6(3), 34-56. doi: 10.11648/j.sf.20250603.11

    Copy | Download

    AMA Style

    Argessa GD. Development and Nutritional Optimization of a Healthy Snack Bar for Children Using Locally Available Ingredients. Sci Front. 2025;6(3):34-56. doi: 10.11648/j.sf.20250603.11

    Copy | Download

  • @article{10.11648/j.sf.20250603.11,
      author = {Gemechu Duguma Argessa},
      title = {Development and Nutritional Optimization of a Healthy Snack Bar for Children Using Locally Available Ingredients
    },
      journal = {Science Frontiers},
      volume = {6},
      number = {3},
      pages = {34-56},
      doi = {10.11648/j.sf.20250603.11},
      url = {https://doi.org/10.11648/j.sf.20250603.11},
      eprint = {https://article.sciencepublishinggroup.com/pdf/10.11648.j.sf.20250603.11},
      abstract = {The rising global demand for healthy, convenient, and ready-to-eat foods has increased the popularity of snack bars, valued for their energy density and portability. This study aimed to develop nutritious snack bars for children using locally available ingredients: oats, faba beans, sunflower seeds, and flax seeds. A mixture design supported by Minitab v.18 generated 17 formulations with varying ingredient ratios. Rosemary leaf extract was added to enhance antioxidant properties, and jaggery was used as a natural sweetener. Proximate analysis showed moisture content of 6-8%, ash 1.12-2.57%, fiber 2-3.5%, fat 5-7%, protein 20-24%, and carbohydrates 58-62%, yielding an energy value of 393-400 Kcal/100g. Mineral content included sodium (5-7 mg), potassium (364-440 mg), calcium (4-8 mg), and magnesium (118-121 mg), with micro-minerals copper (0.4-1.67 mg), iron (6-9.25 mg), and zinc (4-7.5 mg) per 100g. The optimal formulation, with a composite desirability of 0.940494, comprised 48.18g oats, 39.80g faba beans, 4g sunflower seeds, and 8.01g flax seeds. Sensory evaluation confirmed its high acceptability, and microbial analysis verified product safety for up to 30 days of storage.},
     year = {2025}
    }
    

    Copy | Download

  • TY  - JOUR
    T1  - Development and Nutritional Optimization of a Healthy Snack Bar for Children Using Locally Available Ingredients
    
    AU  - Gemechu Duguma Argessa
    Y1  - 2025/07/31
    PY  - 2025
    N1  - https://doi.org/10.11648/j.sf.20250603.11
    DO  - 10.11648/j.sf.20250603.11
    T2  - Science Frontiers
    JF  - Science Frontiers
    JO  - Science Frontiers
    SP  - 34
    EP  - 56
    PB  - Science Publishing Group
    SN  - 2994-7030
    UR  - https://doi.org/10.11648/j.sf.20250603.11
    AB  - The rising global demand for healthy, convenient, and ready-to-eat foods has increased the popularity of snack bars, valued for their energy density and portability. This study aimed to develop nutritious snack bars for children using locally available ingredients: oats, faba beans, sunflower seeds, and flax seeds. A mixture design supported by Minitab v.18 generated 17 formulations with varying ingredient ratios. Rosemary leaf extract was added to enhance antioxidant properties, and jaggery was used as a natural sweetener. Proximate analysis showed moisture content of 6-8%, ash 1.12-2.57%, fiber 2-3.5%, fat 5-7%, protein 20-24%, and carbohydrates 58-62%, yielding an energy value of 393-400 Kcal/100g. Mineral content included sodium (5-7 mg), potassium (364-440 mg), calcium (4-8 mg), and magnesium (118-121 mg), with micro-minerals copper (0.4-1.67 mg), iron (6-9.25 mg), and zinc (4-7.5 mg) per 100g. The optimal formulation, with a composite desirability of 0.940494, comprised 48.18g oats, 39.80g faba beans, 4g sunflower seeds, and 8.01g flax seeds. Sensory evaluation confirmed its high acceptability, and microbial analysis verified product safety for up to 30 days of storage.
    VL  - 6
    IS  - 3
    ER  - 

    Copy | Download

Author Information
  • Abstract
  • Keywords
  • Document Sections

    1. 1. Introduction
    2. 2. Materials and Methods
    3. 3. Results and Discussions
    4. 4. Conclusions
    Show Full Outline
  • Abbreviations
  • Author Contributions
  • Funding
  • Availability of Data and Materials
  • Conflicts of Interest
  • References
  • Cite This Article
  • Author Information