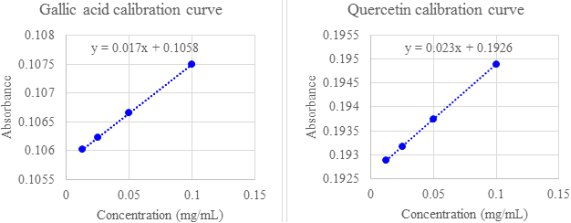
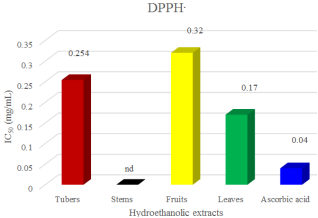
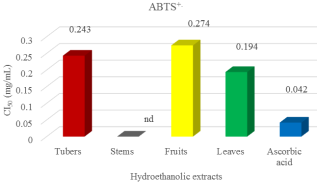
This study is devoted to the determination of polyphenol, flavonoid and mineral contents and then to the evaluation of antioxidant and antibacterial activities of Amorphophallus consimilis extracts. The spectrophotometric method is used for the determination of polyphenol and flavonoid contents with standard solutions of gallic acid and quercetin respectively. The polyphenol content varies from 2.33 (stems) to 4.68 (tubers) µg EAG/g and that of flavonoids from 2.425 (tubers) to 9.373 (stems) µg EQ/g. The antioxidant activity is evaluated by the DPPH• and ABTS+ method. The 50% Inhibitory Concentration (IC50) values obtained with both methods range from 0.17±0.011 (leaves) to 0.254±0.001 (tubers) mg/mL. Atomic absorption spectrophotometry (AAS) is used for the determination of mineral contents. Amorphophallus consimilis contains minerals with average contents of calcium (43 µg/g), iron (11 µg/g), zinc (0.28 µg/g) and copper (0.14 µg/g). The disk diffusion method is used for the evaluation of antibacterial activity. A total of five bacterial strains are used, these are: Escherichia coli ATCC25922, Enterococcus faecalis ATCC29213, Staphylococcus aureus ATCC29212, Pseudomonas (community strain), Candida albican ATCC24433 were used. The minimum inhibitory concentrations (MIC) range from 1.875 to 30 mg/mL, showing overall interesting bacterial activity of the extracts on the strains tested.
| Published in | Science Journal of Chemistry (Volume 13, Issue 6) |
| DOI | 10.11648/j.sjc.20251306.14 |
| Page(s) | 194-201 |
| Creative Commons |
This is an Open Access article, distributed under the terms of the Creative Commons Attribution 4.0 International License (http://creativecommons.org/licenses/by/4.0/), which permits unrestricted use, distribution and reproduction in any medium or format, provided the original work is properly cited. |
| Copyright |
Copyright © The Author(s), 2025. Published by Science Publishing Group |
Amorphophallus Consimilis, Polyphenols, Flavonoids, Minerals, Antioxidants, Antibacterial
Dosed compounds | Tubers | Stems | Fruits | Leaves |
|---|---|---|---|---|
Polyphenol (µg EAG/g) | 4,68±0,002 | 2,33±0,011 | 4,565±0,102 | 4,625±0,011 |
Flavonoid (µg EQ/g) | 2,425±0,001 | 9,373±0,112 | 4,96±0,013 | 3,75±0,020 |
Samples | Element content (µg/g) | |||
|---|---|---|---|---|
Ca | Fe | Zn | Cu | |
Leaves | 54,67±0,001 | 9,95±0,001 | 0,44±0,001 | 0,08±0,0001 |
Tubers | 39,39±0,012 | 12,35±0,011 | 0,26±0,041 | 0,21±0,012 |
Fruits | 39,71±0,001 | 11,76±0,001 | 0,24±0,002 | 0,15±0,0001 |
Stems | 38,63±0,013 | 10,98±0,002 | 0,18±0,001 | 0,11±0,0002 |
Inhibitory concentration at 50% (mg/mL) | |||||
|---|---|---|---|---|---|
Method | Hydro-ethanolic extract | Standard | |||
Tubers | Stems | Fruits | Leaves | Ascorbic accid | |
DPPH. | 0,254± 0,001 | nd | 0,32±0,001 | 0,17±0,011 | 0,04 |
ABTS+. | 0,243±0,002 | nd | 0,274±0,013 | 0,194±0,012 | 0,042 |
Hydro-ethanolic Extract | Amorphophallus Consimilus | |||
|---|---|---|---|---|
Tubers | Stems | Fruits | Leaves | |
Results | - | - | - | - |
Bacteria | Hydro-ethanolic Extracts | |||
|---|---|---|---|---|
Tubers | Stems | Fruits | Leaves | |
Escherichia Coli ATCC25922 | 16 | na | 11 | 13 |
Enterococcus faecalis ATCC 29213 | 12 | na | 9 | 10 |
Staphylococcus aureus ATCC 29212 | 11 | na | 8 | 11 |
Pseudomonas (communitystrain) | 9 | na | 8 | 8 |
Candida Albican ATCC24433 | 11 | na | na | na |
Bacteria | MIC (mg/mL) | ||
|---|---|---|---|
Tubers | Fruits | Leaves | |
Escherichia Coli ATCC25922 | 1,875 | 15 | 3,75 |
Enterococcus faecalis ATCC 29213 | 3,75 | 30 | 7,5 |
Staphylococcus aureus ATCC 29212 | 7,5 | 30 | 15 |
Pseudomonas (communitystrain) | 15 | 30 | 30 |
Candida Albican ATCC24433 | 7,5 | nd | nd |
MIC | Minimum Inhibitory Concentration |
IC50 | Inhibitory Concentration at 50% |
DPPH | 2,2-Diphenyl-1-Picrylhydrazyl Radical |
| [1] | M. Chua, T. C. Baldwin, T. J. Hocking, et K. Chan, «Traditional uses and potential health benefits of Amorphophallus konjac K. Koch ex NE Br.», J. Ethnopharmacol., vol. 128, no 2, p. 268‑278, 2010, |
| [2] | J. A. Shilpi, P. K. Ray, M. M. Sarder, et S. J. Uddin, «Analgesic activity of Amorphophallus campanulatus tuber», Fitoterapia, vol. 76, no 3‑4, p. 367‑369, 2005, |
| [3] | S. K. Reddy, S. A. Kumar, V. D. Kumar, and S. Ganapaty, «Anti-inflammatory and analgesic activities of Amorphophallus bulbifer (Roxb) Kunth whole plant», Trop. J. Pharm. Res., vol. 11, no 6, p. 971‑976, 2012, |
| [4] | F. Islam et al., «Genus Amorphophallus: A Comprehensive Overview on Phytochemistry, Ethnomedicinal Uses, and Pharmacological Activities», Plants, vol. 12, no 23, p. 3945, 2023, |
| [5] | S. Raj et K. M. Gothandam, «Immunomodulatory activity of methanolic extract of Amorphophallus commutatus var. wayanadensis under normal and cyclophosphamide induced immunosuppressive conditions in mice models», Food Chem. Toxicol., vol. 81, p. 151‑159, 2015, |
| [6] | Y. N. Dey, S. Ota, N. Srikanth, M. Jamal, et M. Wanjari, «A phytopharmacological review on an important medicinal plant-Amorphophallus paeoniifolius», AYU Int. Q. J. Res. Ayurveda, vol. 33, no 1, p. 27‑32, 2012, |
| [7] | J. Swain, A. Jaiswal, et S. Kumar, «Medicinal values of Amorphophallus species», Indigenous Traditional Knowledge and Advancement in Medicinal Plants Research, 2022, |
| [8] | Abdou Khadre Diouf et al., «Phytochemical screening: Determination of total polyphenol and flavonoid contents, antioxidant and antimicrobial activity of leaves and seeds of Abelmoschus esculentus L.», World J. Adv. Res. Rev., vol. 19, no 1, p. 394‑402, 2023, |
| [9] | Mame Coumba Diop et al., «Optimization of extraction conditions by the dosage of polyphenols and determination of antioxidant activity: Case of Melothria maderaspatana organs, a plant used in traditional African medicine for the treatment of diabetes», Int. J. Frontline Res. Multidiscip. Stud., vol. 2, no 1, p. 001‑009, 2023, |
| [10] | H. Tirera et al., «Study of the antioxydant activity and determination of the content of mineral elements in the leaves and flowers of Ziziphus mauritiana lam», Int. J. Pharm. Phys.-Chem. Nutr. Anal., vol. 1, no 1, p. 29‑33, 2021, |
| [11] | I. Diallo et al., «Phytochemical screening; determination of total polyphenol and flavonoid contents, and antioxidant activity of different parts of Datura metel L.», IOSR Journal Of Pharmacy And Biological Sciences (IOSR-JPBS), p. 24‑31, 2022, |
| [12] | I. Diallo, B. Mbow, E. O. FAYE, A. SENE, et M. FOFANA, «Phytochemical study, determination of the antioxidant and antimicrobial activities of the bark and root extracts of Bridelia micrantha, a plant widely used in traditional African medicine», IOSR Journal of Applied Chemistry (IOSR-JAC), p. 08‑14, 2022, |
| [13] | S. O. Sarr et al., « Study of the antioxydant of extracts from the leaves of Vitex doniana (Verbenacea) », Int. J. Biol. Chem. Sci., vol. 9, no 3, p. 1263‑1269, 2015, |
| [14] | Y. Vaghasiya, «Screening of some medicinal plants for antimicrobial properties-phytochemical and pharmacological studies of a selected medicinal plant», PhD Thesis, Saurashtra University, 2009. Accessed on: 12 may 2025. |
| [15] | O. D. Badji et al., «Phytochemical screening and determination of antimicrobial activity of different extracts from the roots and leaves of Stylocheaton Hypogaeus, a plant used for the treatment of prostatitis in Senegal», Int. J. Biosci. IJB, 2025, |
| [16] | A. D. Kone, B. Mbow, A. A. Gaye, S. F. Ndoye, et M. Gaye, «Ficus sycomorus L. extracts: Phytochemical screening, total polyphenols and flavonoids contents, antioxidant and antibacterial activity», Sci. J. Chem., vol. 10, no 4, p. 126‑132, 2022, |
| [17] | What Is Iron: Role, Benefits, and Food Sources, Alvityl. Accessed on: 21 june 2025. |
APA Style
Ibrahima, D., Harouna, T., Abdoulaye, D., Bedie, M., Biram, S. P., et al. (2025). Quantitative Phytochemical Analysis and Bioactivities of Hydroethanolic Extracts of Amorphophallus consimilis. Science Journal of Chemistry, 13(6), 194-201. https://doi.org/10.11648/j.sjc.20251306.14
ACS Style
Ibrahima, D.; Harouna, T.; Abdoulaye, D.; Bedie, M.; Biram, S. P., et al. Quantitative Phytochemical Analysis and Bioactivities of Hydroethanolic Extracts of Amorphophallus consimilis. Sci. J. Chem. 2025, 13(6), 194-201. doi: 10.11648/j.sjc.20251306.14
AMA Style
Ibrahima D, Harouna T, Abdoulaye D, Bedie M, Biram SP, et al. Quantitative Phytochemical Analysis and Bioactivities of Hydroethanolic Extracts of Amorphophallus consimilis. Sci J Chem. 2025;13(6):194-201. doi: 10.11648/j.sjc.20251306.14
@article{10.11648/j.sjc.20251306.14,
  author = {Diallo Ibrahima and Tirera Harouna and Diop Abdoulaye and Mbow Bedie and Sy Papa Biram and Diop Seydina and Faye Elhadji Ousmane and Fofana Mouhamadou and Sarr Serigne Omar and Sene Aboubacary},
  title = {Quantitative Phytochemical Analysis and Bioactivities of Hydroethanolic Extracts of Amorphophallus consimilis},
  journal = {Science Journal of Chemistry},
  volume = {13},
  number = {6},
  pages = {194-201},
  doi = {10.11648/j.sjc.20251306.14},
  url = {https://doi.org/10.11648/j.sjc.20251306.14},
  eprint = {https://article.sciencepublishinggroup.com/pdf/10.11648.j.sjc.20251306.14},
  abstract = {This study is devoted to the determination of polyphenol, flavonoid and mineral contents and then to the evaluation of antioxidant and antibacterial activities of Amorphophallus consimilis extracts. The spectrophotometric method is used for the determination of polyphenol and flavonoid contents with standard solutions of gallic acid and quercetin respectively. The polyphenol content varies from 2.33 (stems) to 4.68 (tubers) µg EAG/g and that of flavonoids from 2.425 (tubers) to 9.373 (stems) µg EQ/g. The antioxidant activity is evaluated by the DPPH• and ABTS+ method. The 50% Inhibitory Concentration (IC50) values obtained with both methods range from 0.17±0.011 (leaves) to 0.254±0.001 (tubers) mg/mL. Atomic absorption spectrophotometry (AAS) is used for the determination of mineral contents. Amorphophallus consimilis contains minerals with average contents of calcium (43 µg/g), iron (11 µg/g), zinc (0.28 µg/g) and copper (0.14 µg/g). The disk diffusion method is used for the evaluation of antibacterial activity. A total of five bacterial strains are used, these are: Escherichia coli ATCC25922, Enterococcus faecalis ATCC29213, Staphylococcus aureus ATCC29212, Pseudomonas (community strain), Candida albican ATCC24433 were used. The minimum inhibitory concentrations (MIC) range from 1.875 to 30 mg/mL, showing overall interesting bacterial activity of the extracts on the strains tested.},
 year = {2025}
}
TY  - JOUR
T1  - Quantitative Phytochemical Analysis and Bioactivities of Hydroethanolic Extracts of Amorphophallus consimilis
AU  - Diallo Ibrahima
AU  - Tirera Harouna
AU  - Diop Abdoulaye
AU  - Mbow Bedie
AU  - Sy Papa Biram
AU  - Diop Seydina
AU  - Faye Elhadji Ousmane
AU  - Fofana Mouhamadou
AU  - Sarr Serigne Omar
AU  - Sene Aboubacary
Y1  - 2025/12/31
PY  - 2025
N1  - https://doi.org/10.11648/j.sjc.20251306.14
DO  - 10.11648/j.sjc.20251306.14
T2  - Science Journal of Chemistry
JF  - Science Journal of Chemistry
JO  - Science Journal of Chemistry
SP  - 194
EP  - 201
PB  - Science Publishing Group
SN  - 2330-099X
UR  - https://doi.org/10.11648/j.sjc.20251306.14
AB  - This study is devoted to the determination of polyphenol, flavonoid and mineral contents and then to the evaluation of antioxidant and antibacterial activities of Amorphophallus consimilis extracts. The spectrophotometric method is used for the determination of polyphenol and flavonoid contents with standard solutions of gallic acid and quercetin respectively. The polyphenol content varies from 2.33 (stems) to 4.68 (tubers) µg EAG/g and that of flavonoids from 2.425 (tubers) to 9.373 (stems) µg EQ/g. The antioxidant activity is evaluated by the DPPH• and ABTS+ method. The 50% Inhibitory Concentration (IC50) values obtained with both methods range from 0.17±0.011 (leaves) to 0.254±0.001 (tubers) mg/mL. Atomic absorption spectrophotometry (AAS) is used for the determination of mineral contents. Amorphophallus consimilis contains minerals with average contents of calcium (43 µg/g), iron (11 µg/g), zinc (0.28 µg/g) and copper (0.14 µg/g). The disk diffusion method is used for the evaluation of antibacterial activity. A total of five bacterial strains are used, these are: Escherichia coli ATCC25922, Enterococcus faecalis ATCC29213, Staphylococcus aureus ATCC29212, Pseudomonas (community strain), Candida albican ATCC24433 were used. The minimum inhibitory concentrations (MIC) range from 1.875 to 30 mg/mL, showing overall interesting bacterial activity of the extracts on the strains tested.
VL  - 13
IS  - 6
ER  -
Departement of Chemistry, Cheikh Anta Diop University of Dakar (UCAD), Dakar, Senegal
MicoCSBsystm Biotechnology Research and Expertise Unit, Dakar, Senegal
Departement of Chemistry, Cheikh Anta Diop University of Dakar (UCAD), Dakar, Senegal
Departement of Chemistry, Cheikh Anta Diop University of Dakar (UCAD), Dakar, Senegal
Faculty of Medicine, Pharmacy and Dentistry, Cheikh Anta Diop University (UCAD), Dakar, Senegal
Information