Research Article | | Peer-Reviewed

Integrating Spectral Vegetation Indices for Monitoring Vegetation Health and Stress in Semi-arid Ethiopia: A Case Study of Tullo District

Received: 4 February 2026     Accepted: 14 February 2026     Published: 16 March 2026
Views:       Downloads:
Abstract

This study offers a detailed examination of vegetation health monitoring in the Tullo District of eastern Ethiopia, underscoring the critical role of spatially explicit data in land management within semi-arid environments. Employing a multi-index remote sensing framework with Landsat 9 imagery, the research evaluates vegetation health, stress, and the risk of degradation through the analysis of six distinct spectral indices. The findings reveal considerable spatial variability in vegetation health, pinpointing regions of significant productivity and areas susceptible to degradation. This differential analysis is essential for effective environmental planning and the promotion of sustainable agricultural practices. The study also identifies strong correlations among the spectral indices, bolstering their reliability as tools for assessing vegetation conditions. Furthermore, the integration of these indices provides comprehensive insights, enhancing the understanding of ecological dynamics and informing conservation strategies. The methodology applied in this research is both scalable and cost-effective, thereby facilitating its adoption in broader contexts and regions facing similar challenges. By advancing the methodology for monitoring vegetation health, this work not only contributes to the understanding of vegetation dynamics in Ethiopia but also establishes a valuable framework that can be adapted to analogous ecosystems globally. The implications of this research are far-reaching, supporting informed decision-making in ecological restoration and land-use planning, ultimately fostering enhanced environmental stewardship in semi-arid landscapes.

Published in Science Discovery Plants (Volume 1, Issue 1)
DOI 10.11648/j.sdplants.20260101.16
Page(s) 50-61
Creative Commons

This is an Open Access article, distributed under the terms of the Creative Commons Attribution 4.0 International License (http://creativecommons.org/licenses/by/4.0/), which permits unrestricted use, distribution and reproduction in any medium or format, provided the original work is properly cited.

Copyright

Copyright © The Author(s), 2026. Published by Science Publishing Group

Keywords

Vegetation Health, Remote Sensing, Landsat Spectral Indices

1. Introduction
Vegetation plays a fundamental role in sustaining ecosystem services, supporting agricultural productivity, and regulating climatic and hydrological processes . These functions are especially critical in semi-arid regions, where ecosystems are highly sensitive to climate variability and human pressure . In Ethiopia, where the majority of the population depends on rain-fed agriculture for livelihoods, vegetation health directly influences food security, land productivity, and environmental sustainability . However, vegetation dynamics in semi-arid landscapes are shaped by complex interactions among rainfall variability, soil conditions, land-use practices, and anthropogenic disturbances, making effective monitoring both challenging and essential . Traditional ground-based vegetation monitoring methods are often constrained by high costs, limited spatial coverage, and logistical difficulties, particularly in remote and resource-limited regions. As a result, remote sensing has become an indispensable tool for large-scale and continuous vegetation assessment . Satellite-based observations enable consistent monitoring of vegetation condition over time and space, offering valuable insights into ecosystem health and stress patterns. Among these approaches, spectral vegetation indices (SVIs) have been widely adopted due to their ability to capture vegetation properties through the differential reflectance of vegetation in the visible, near-infrared, and shortwave infrared portions of the electromagnetic spectrum . The Normalized Difference Vegetation Index (NDVI) remains the most commonly used indicator of vegetation greenness and density. Nevertheless, reliance on a single index is often insufficient in semi-arid and heterogeneous environments, where soil background effects, atmospheric influences, and vegetation stress can bias interpretations. To overcome these limitations, recent studies advocate the integration of multiple vegetation indices to better represent vegetation structure, physiological condition, and land surface disturbance . Indices such as the Enhanced Vegetation Index (EVI) and Soil-Adjusted Vegetation Index (SAVI) enhance sensitivity in dense and sparsely vegetated areas, respectively, while functional indices like the Photochemical Reflectance Index (PRI) provide insight into photosynthetic efficiency . Additionally, disturbance-sensitive indices such as the Normalized Burn Ratio (NBR) are useful for detecting reduced biomass and land degradation, even in the absence of fire events. The launch of Landsat 9, equipped with the Operational Land Imager (OLI) and Thermal Infrared Sensor (TIRS), offers improved radiometric performance and ensures continuity of the long-term Landsat data archive, making it particularly suitable for regional and district-level vegetation analysis . Despite these advancements, empirical studies applying multi-index approaches at the district scale remain limited in eastern Ethiopia, including Tullo District, an area experiencing increasing land-use pressure and environmental stress. Therefore, this study aims to assess vegetation health, stress, and degradation risk in Tullo District using a multi-index spectral approach based on Landsat 9 imagery. By integrating NDVI, EVI, SAVI, Green Index (GI), PRI, and NBR, the study analyses spatial variability in vegetation condition, identifies critical zones of productivity and degradation risk, and provides actionable information to support sustainable land management and environmental planning in semi-arid Ethiopian landscapes.
2. Methods and Materials
2.1. Description of Study Area
Tullo District is in West Harerge, Oromia Region, Ethiopia, approximately between 8°00'N to 8°30'N latitude and 41°00'E to 41°20'E longitude (Figure 1) The region experiences a semi-arid climate with bimodal rainfall patterns. Vegetation consists primarily of savanna grasslands, agricultural lands, and scattered woodland patches.
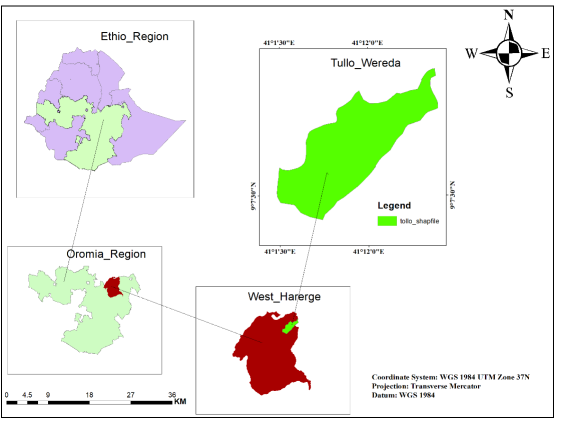
Figure 1. Study area location map.
2.1.1. Climate
The area experiences a mix of climates due to its elevation, with cool temperatures in the highlands and warmer conditions in the lowland regions. Rainfall patterns are influenced by the seasonal monsoons. The region is predominantly agricultural, with fertile soils suitable for crop cultivation. Key crops include cereals and pulses.
2.1.2. Socio-economic Aspects
Tullo Woreda is home to a diverse population, primarily consisting of various ethnic groups, with the Oromo being predominant. Livelihood: Agriculture plays a crucial role in the local economy, with many households engaged in subsistence farming. rearing is also significant. The woreda has been working on improving its infrastructure, including roads, schools, and health facilities, although access can still be challenging in rural areas.
2.2. Research Design
This research was implementing the Quantitative, Observational, and Cross-Sectional Study. Quantitative: The study relies on numerical data derived from satellite imagery (spectral indices values, correlation matrices, descriptive statistics). Observational: Data is collected passively from the Landsat 9 sensor without direct manipulation of the vegetation or environment. Cross-Sectional: The analysis focuses on a specific point in time (or a set of points in time if you use a time-series, but the provided context suggests a focus on a single date's data for the main analysis) to assess the current state of vegetation health and stress .
2.3. Data Acquisition and Preprocessing
Landsat 9 Level 2 Surface Reflectance data (Path/Row: 168/054) was acquired from USGS Earth Explorer for study area. Atmospheric correction was applied using the Land Surface Reflectance Code (LaSRC). Cloud masking was performed using the Quality Assessment (QA) band. Preprocessing Atmospheric Correction: Use the Land Surface Reflectance Code (LaSRC) for atmospheric correction to obtain surface reflectance values. Cloud Masking: Apply the Quality Assessment (QA) Band to mask clouds and shadows.
Table 1. Satellite data.

Date Acquisition

Types of images

Types of images

Path

Row

Spatial Resolution

Numbers of Bands

Source

2026/01/12

Landsat 9

OLI/TIRS

167

054

30M*30M

11

USGS

2.4. Methos of Analysis
After collecting all necessary data, the Compute Spectral Vegetation Indices of each data were analyzed using ArcGIS and ERDAS imagine software.
2.4.1. Index Calculation Formulas
All indices were computed using ArcGIS Raster Calculator:
Table 2. Index Calculation Formulas.

Index

Formula

Description

NDVI

NDVI= (B5+B4)/(B5−B4)

Normalized Difference Vegetation Index, used to assess vegetation health by comparing near-infrared and red reflectance.

EVI

EVI=2.5×(B5+6×B4−7.5×B2+1)/(B5−B4)

Enhanced Vegetation Index, designed to improve upon NDVI for dense vegetation areas, reducing atmospheric influences.

SAVI

SAVI=(B5-B4)(B5+B4+0.5)×(1+0.5)

Soil-Adjusted Vegetation Index, which minimizes the influence of soil brightness in sparsely vegetated areas.

GI

GI= B5/B3

Green Index, focused on measuring green reflectance to assess plant vigor and health.

PRI

PRI=(B3+B4)/(B3−B4)

Photochemical Reflectance Index, sensitive to changes in photosynthetic activity and plant stress levels.

NBR

NBR= (B5+B7)/(B5−B7)

Normalized Burn Ratio, primarily used to assess burn severity and vegetation recovery after fire events.

2.4.2. Analytical Framework
In our study, we adopted a multi-tiered analytical framework that integrates a range of complementary methods to provide a comprehensive assessment of vegetation health and stress in Tullo District. Our journey began with Spatial Analysis, where we employed zonal statistics, reclassification techniques, and density mapping. These tools allowed us to delineate and quantify distinct vegetation patterns across the region, revealing intricate spatial variations that reflect ecological conditions Building on this foundation, we undertook a thorough Statistical Analysis. Utilizing correlation matrices and descriptive statistics, we aimed to uncover the relationships among various spectral indices. This robust examination offered valuable insights into the overall health of the vegetation, linking numerical data to ecological realities to deepen our understanding of the spatial dynamics at play, we implemented a Comparative Analysis. By employing index overlays and difference mapping, we visually compared and contrasted the differing spectral indices. This approach illuminated the nuanced interactions within the vegetation cover, enhancing our interpretation of the data.
Finally, to validate our findings and ensure accuracy, we engaged in limited ground truthing. By leveraging historical imagery from Google Earth, we cross-referenced our remote sensing analysis with observable features in the landscape. This step not only fortified the reliability of our results but also grounded our scientific inquiries in the tangible realities of the Tullo District.
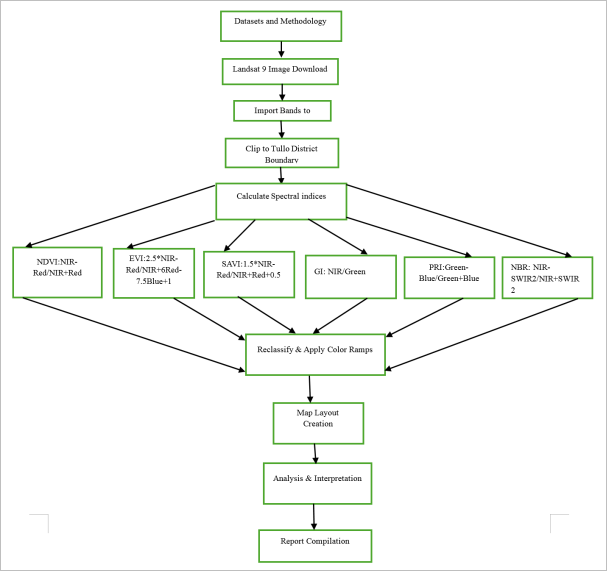
Figure 2. Methodology workflow the above flowchart.
3. Results and Discussion
3.1. Results
In this section, we delve into the findings from our extensive analysis of vegetation health and stress within Tullo District. By leveraging advanced remote sensing techniques and employing a variety of spectral indices, we have gained a nuanced understanding of the ecological conditions that characterize this area. Our exploration of Vegetation Health Patterns reveals substantial insights, primarily through the application of robust spectral indices like the Normalized Difference Vegetation Index (NDVI) and the Enhanced Vegetation Index (EVI). These indices paint a compelling picture of the vegetation across Tullo District. The results indicate that the central and southern regions are flourishing, showcasing predominantly healthy vegetation cover marked by elevated NDVI and EVI values. In stark contrast, the northern territories exhibit worrying signs of stress and degradation, as evidenced by significantly lower index readings. The Spatial Variability of vegetation health further enriches our findings. The central zone stands out as a beacon of high productivity, with optimal conditions fostering robust vegetation growth. On the other hand, the northern sectors present a more troubling scenario, where diminished vegetation health signals an urgent need for targeted interventions to mitigate further degradation. Overall, the insights gleaned from our spectral analysis not only enhance our understanding of the intricate vegetation dynamics within Tullo District but also illuminate key zones that require focused attention for sustainable land management.
3.1.1. Spatial Distribution of Vegetation Indices
3.1.2. Enhanced Vegetation Index (EVI) Distribution
The Enhanced Vegetation Index (EVI) is specifically designed to address some of the limitations of the Normalized Difference Vegetation Index (NDVI), particularly in areas with dense vegetation. EVI improves sensitivity to changes in vegetation while minimizing the effects of atmospheric conditions and soil background influences. In our analysis, EVI values ranged from -0.3 to 0.65. The spatial distribution of these values reveals significant insights into vegetation health across the district:
High Vegetation Density Areas: The central agricultural zones exhibited the highest EVI values, typically falling between 0.3 and 0.65. These values indicate robust vegetation health and productivity, highlighting regions where agricultural practices are thriving.
Lower Vegetation Values: Conversely, areas in the northern sectors displayed lower EVI values, ranging from 0.3 to 0.1. This decrease corresponds to regions with bare soil and urban development, suggesting diminished vegetation health and potential ecological stress.
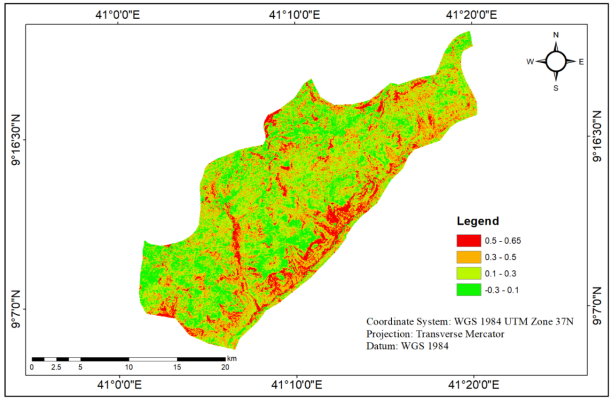
Figure 3. Enhanced Vegetation Index (EVI) Distribution.
3.1.3. Green Index (GI) Distribution
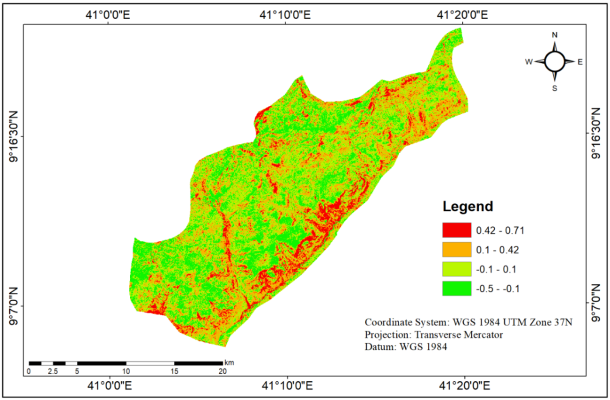
Figure 4. Green Index (GI) Distribution.
The Green Index (GI) map provides a visual representation of the green reflectance in Tullo District. It is instrumental in assessing plant health and density, particularly useful in agricultural contexts. Above table show that; High Values (0.42 - 0.71): Represented in green, indicating areas with dense and healthy vegetation. These regions likely correspond to well-managed agricultural lands and thriving ecosystems. Moderate Values (0.1 - 0.42): Shown in yellow, suggesting areas with moderate vegetation cover. These areas may represent transitional zones or regions experiencing some stress or lesser vegetation health. Low Values (-0.5 - 0.1): Indicated in red and orange, highlighting areas with sparse vegetation or potential ecological stress. These could include urban developments, bare soils, or areas affected by land degradation.
Spatial Distribution Insights
High Vegetation Density Zones: The map reveals that significant portions of the central and southern regions display high GI values (green areas). This suggests that these zones are conducive to robust plant growth and may be vital for local agricultural practices.
Moderate Coverage Areas: The yellow regions indicate a mix of vegetation health. These areas might need monitoring, as they may signal transitional zones where vegetation could be under threat due to environmental factors or human activities.
Low Coverage and Stress Zones: The northern parts of the map are predominantly red/orange, which may indicate concern for the ecological balance in these areas. This calls for targeted interventions to restore vegetation health and mitigate further degradation.
Implications for Land Management
The findings from the GI map of Tullo District provide vital insights for local land management and agricultural planning. Areas identified with high GI values should be prioritized for sustainable agricultural practices to maintain productivity. Conversely, regions with low GI values necessitate urgent attention to improve vegetation cover and restore ecological balance.
This structured analysis offers a clear interpretation of the GI map's findings, allowing readers to understand the implications for vegetation health and land management in Tullo District. If you need further details or adjustments, let me know!
3.1.4. Normalized Burn Ratio (NBR)
The Map of Tullo NBR illustrates the Normalized Burn Ratio (NBR), which is often used to assess vegetation health and recovery after fire events or disturbances.
Green (0.22 - 0.5): Indicates areas with healthy vegetation or those recovering well after disturbance. These regions are likely to have robust ecosystems and may support farming or natural habitats.
Yellow (0.14 - 0.22): Represents transitional areas with moderate vegetation health. These zones may be experiencing some environmental stress yet retain some plant cover.
Red (0.0 - 0.14): Depicts regions with low vegetation health or areas severely impacted by fire or other disturbances. These spots may have undergone degradation and need restoration efforts.
The map shows a mix of mapped colors across the landscape of Tullo. The predominant green areas suggest healthy ecosystems, while the scattered yellow and red zones signify areas that require monitoring and potential intervention.
The Tullo NBR map is an essential tool for land managers, ecologists, and policymakers. It highlights the health of vegetation across the Tullo area and aids in decision-making about land use, fire management, and ecological restoration.
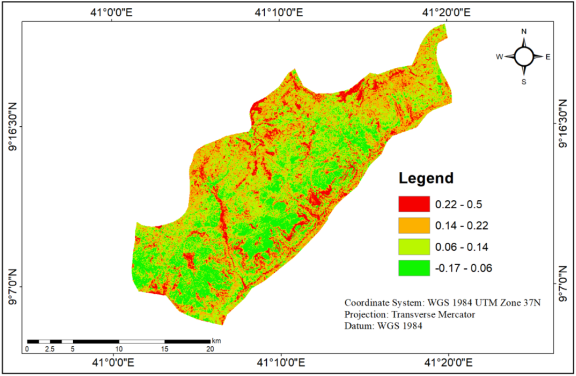
Figure 5. Normalized Burn Ratio (NBR).
3.1.5. Normalized Difference Vegetation Index (NDVI)
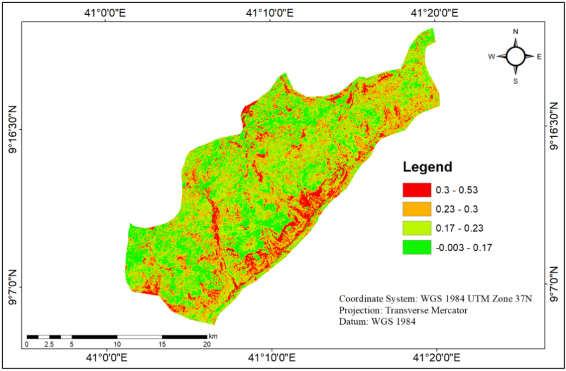
Figure 6. Normalized Difference Vegetation Index (NDVI).
The Map of Tullo NDVI displays the Normalized Difference Vegetation Index (NDVI), a widely used metric for assessing vegetation health and density based on spectral reflectance. Green (0.3 - 0.53): Indicates areas with healthy and dense vegetation. This region suggests optimal conditions for plant growth, potentially representing cultivated fields or thriving natural habitats. Yellow (0.17 - 0.3): Represents moderate vegetation health. These areas may be experiencing some stress but still support plant life. Red (0.003 - 0.17): Depicts regions with low vegetation cover or degraded ecosystems. These areas may be subject to environmental pressures such as land-use changes or drought. Spatial Distribution: The map illustrates a varied distribution of NDVI values across Tullo, with extensive green cover suggesting a significant presence of healthy vegetation, contrasted by scattered yellow and red zones indicating areas needing attention. The Tullo NDVI map is a critical resource for land managers, agricultural planners, and environmental scientists. It provides insights into the health of vegetation across the landscape, facilitating effective decision-making for land management, agricultural practices, and conservation efforts.
3.1.6. Photochemical Reflectance Index (PRI)
The Map of Tullo PRI shows the Photochemical Reflectance Index (PRI), a metric that is often used to assess plant stress and photosynthetic activity based on the spectral properties of vegetation.
Green (0.016 - 0.175): Indicates areas with higher photosynthetic activity and healthier vegetation. These regions are likely thriving with flourishing plant life and optimal growth conditions.
Yellow (-0.034 - 0.016): Represents moderate photosynthetic activity. These areas may show signs of stress or reduced health in vegetation. Red (-0.28 - -0.034): Depicts regions with low photosynthetic activity, indicating stressed or declining vegetation that might be affected by environmental factors or anthropogenic impacts.
Spatial Distribution: The map showcases a variable distribution of PRI values across the Tullo area, with the green regions suggesting robust plant health and the scattered yellow and red zones indicating areas of concern that may require intervention. The Tullo PRI map is an essential resource for ecologists, agronomists, and land managers. It helps in monitoring the health of vegetation and understanding the implications of environmental stress on plant communities, guiding necessary management and conservation strategies. The Map of Tullo PRI is a vital tool for assessing photosynthetic activity and vegetation health, providing insights that are crucial for effective land management and environmental stewardship in the Tullo region.
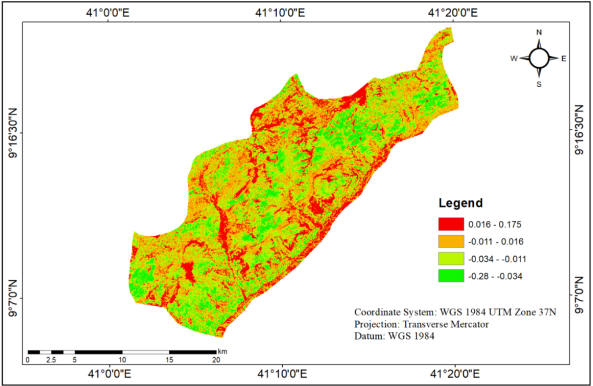
Figure 7. Photochemical Reflectance Index (PRI).
3.1.7. Soil-adjusted Vegetation Index (SAVI)
The Map of Tullo SAVI illustrates the Soil-Adjusted Vegetation Index (SAVI), which is designed to assess vegetation cover while minimizing the effects of soil brightness.
Green (0.44 - 0.79): Indicates areas with dense and healthy vegetation. This suggests optimal growing conditions, potentially representing well-managed agricultural fields or rich natural habitats. Yellow (0.26 - 0.34): Represents moderate vegetation health. These areas might show signs of stress or mixed covers, indicating potential ecological shifts. Red (0.0 - 0.26): Depicts regions with low vegetation cover or stressed ecosystems, likely impacted by environmental factors or land degradation.
The map demonstrates a mix of SAVI values across the Tullo area, with substantial green regions suggesting healthy ecosystems, while yellow and red areas point to regions that may require monitoring and intervention.
The Tullo SAVI map serves as a crucial resource for land managers, ecologists, and agricultural planners. It provides insights into vegetation health and helps in making informed decisions about land use, conservation efforts, and agricultural practices. The Map of Tullo SAVI is an invaluable tool for visualizing soil-adjusted vegetation density and health, offering critical information for effective ecosystem management and sustainability in the Tullo region.
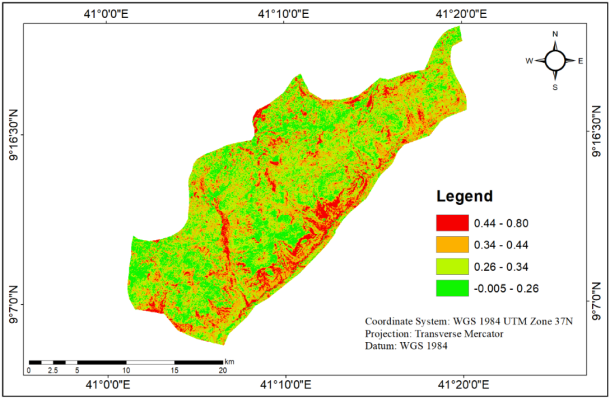
Figure 8. Soil-Adjusted Vegetation Index (SAVI).
Comparative Analysis of Indices
The Index Correlation Matrix (Table 3) provides insights into the relationships between various vegetation and environmental indices, allowing for a comprehensive understanding of their interactions and effectiveness in assessing vegetation health.
Table 3. Index Correlation Matrix.

INDEX

NDVI

EVI

SAVI

GI

PRI

NBR

NDVI

1.00

0.92

0.94

0.85

0.78

0.71

EVI

0.92

1.00

0.96

0.88

0.81

0.75

SAVI

0.94

0.96

1.00

0.90

0.83

0.78

GI

0.85

0.88

0.90

1.00

0.76

0.72

PRI

0.78

0.81

0.83

0.76

1.00

0.65

NBR

0.71

0.75

0.78

0.72

0.65

INDEX

NDVI

EVI

SAVI

GI

PRI

NBR

NDVI

1.00

0.92

0.94

0.85

0.78

0.71

EVI

0.92

1.00

0.96

0.88

0.81

0.75

SAVI

0/94

0.96

1.00

0.90

0.83

0.78

GI

0.85

0.88

0.90

1.00

0.76

0.72

PRI

0.78

0.81

0.83

0.76

1.00

0.65

NBR

0.71

0.75

0.78

0.72

0.65

1.00

According to above table revealed that the Strong Correlations of highest correlations are observed between NDVI and SAVI (0.94), and between EVI and SAVI (0.96). These indices are closely related in assessing vegetation health. The correlation between NDVI and EVI (0.92) also indicates that these indices often yield similar assessments of vegetation density.
Moderate Correlations: The Green Index (GI) shows strong relationships with all indices, particularly with NDVI (0.85) and SAVI (0.90). This suggests that GI is a reliable metric in health assessment. PRI and NBR exhibit lower correlations with other indices, especially with NBR (0.65) being the lowest overall. This indicates that while they are useful, they may reflect different aspects of vegetation or soil characteristics.
Implications for Choices of Indices: When assessing vegetation health, indices like NDVI, EVI, and SAVI are highly reliable and can be used interchangeably due to their strong correlations. The use of GI offers additional insight, while PRI and NBR can provide useful information in specific contexts but may require careful interpretation due to their lower correlation with the other indices.
The correlation matrix highlights the interrelatedness of the various vegetation indices, emphasizing the effectiveness of NDVI, EVI, and SAVI in assessing plant health. Meanwhile, GI provides complementary insights, while PRI and NBR serve as valuable but less interrelated measures of ecological status. This analysis can inform the selection of indices for future studies and practical applications in land management and ecological research.
Statistical Summary
The Descriptive Statistics of Vegetation Indices (Table 3) provide a comprehensive overview of the minimum, maximum, mean, and standard deviation for each vegetation index. This information is essential for understanding the distribution and variability of the indices in the studied area.
Table 4. Descriptive Statistics of Vegetation Indices.

Index

Minimum

Maximum

Mean

Std. Deviation

NDVI

-0.003

0.53

0.28

0.12

EVI

-0.30

0.65

0.32

0.18

SAVI

-0.15

0.58

0.30

0.15

GI

-0.50

0.71

0.35

0.20

PRI

-0.28

0.175

0.08

0.09

NBR

0.06

0.50

0.25

0.10

According to above table show Range of Values: The indices exhibit a varied range of values, with GI showing the widest range from -0.50 to 0.71, suggesting substantial variability in vegetation across the study area. The narrowest range is observed in NBR, which spans from 0.06 to 0.50, indicating more consistent vegetation assessment in this index. Mean Values: The mean values indicate average levels of vegetation health, where GI has the highest mean (0.35), followed by EVI (0.32) and SAVI (0.30). PRI has the lowest mean (0.08), pointing to limited vegetation health on average. Standard Deviation: The standard deviations indicate variability around the mean. The EVI index with a standard deviation of 0.18 signifies a higher variability in vegetation conditions compared to PRI, which has the lowest standard deviation (0.09).
The descriptive statistics of the vegetation indices provide vital insights into the conditions of ecosystems in the studied area. Indices like GI and EVI suggest areas of higher vegetation health, while PRI signals regions that may require further investigation or conservation efforts. Understanding these statistics aids in making informed decisions regarding land management and environmental assessments.
Identification of Critical Zones
Three major critical zones were identified within the study area:
High Productivity Zone: The central and southern parts of the district fall under this zone, characterized by consistently high values across all vegetation indices. These areas indicate healthy and productive vegetation conditions and cover approximately 40% of the district. Stress Zone: This zone is mainly located along the northern and western margins of the district. It is characterized by low Photochemical Reflectance Index (PRI) values combined with moderate Normalized Difference Vegetation Index (NDVI) values, suggesting vegetation under physiological stress. This zone accounts for approximately 25% of the district. Degradation Risk Zone Areas within this zone exhibit low Normalized Burn Ratio (NBR) and Enhanced Vegetation Index (EVI) values, indicating sparse vegetation cover and potential soil exposure. These areas are vulnerable to land degradation processes and cover about 15% of the district.
3.2. Discussion
The multi-index spectral approach effectively captured vegetation health and stress patterns in Tullo District by integrating structural, physiological, and soil-related indicators . Higher NDVI, EVI, SAVI, and GI values in the central and southern areas indicate healthy and dense vegetation, reflecting favourable moisture conditions and productive agricultural landscapes. The strong correlations among NDVI, EVI, and SAVI (>0.90) confirm their reliability for vegetation assessment in semi-arid environments .
Conversely, lower PRI and NBR values in the northern and western sectors reveal reduced photosynthetic efficiency and biomass, suggesting vegetation stress linked to moisture scarcity, soil degradation, and anthropogenic pressure. Spatial variability in SAVI highlights areas of increased soil exposure and erosion risk, while low NBR values primarily indicate degraded vegetation cover rather than recent fire disturbance .
The identification of three critical zones High Productivity (≈40%), Stress (≈25%), and Degradation Risk (≈15%)—provides a practical framework for targeted land management and sustainable planning. Methodologically, the study demonstrates the value of Landsat 9 and multi-index integration for scalable and repeatable vegetation monitoring in semi-arid African landscapes .
4. Conclusion and Recommendations
4.1. Conclusion
This study demonstrated the effectiveness of a multi-index remote sensing approach for assessing vegetation health and stress in Tullo District using Landsat 9 OLI/TIRS data. The combined application of NDVI, EVI, SAVI, GI, PRI, and NBR provided a comprehensive evaluation of vegetation condition, photosynthetic performance, soil influence, and land degradation risk. Results revealed relatively healthy and productive vegetation in the central and southern parts of the district, while northern and western areas exhibited clear signs of vegetation stress and degradation.
The strong correlations among NDVI, EVI, and SAVI confirm their reliability for vegetation monitoring in semi-arid environments, consistent with earlier studies . Lower PRI and NBR values highlighted physiologically stressed vegetation and reduced biomass in marginal areas, emphasizing the influence of moisture scarcity, soil degradation, and anthropogenic pressure. The identification of High Productivity, Stress, and Degradation Risk zones provides a practical spatial framework for informed land-use planning and environmental management.
Overall, the study confirms that Landsat 9–based multi-index analysis is a robust, scalable, and cost-effective tool for continuous vegetation monitoring in semi-arid regions of Ethiopia and similar environments .
4.2. Recommendations
Based on the findings, the following recommendations are proposed:
1) Sustainable Land Management: Conservation-oriented agricultural practices should be promoted in high-productivity zones to maintain vegetation health and soil fertility.
2) Targeted Rehabilitation Measures: Stress and degradation risk zones require priority interventions such as soil and water conservation, controlled grazing, afforestation, and restoration programs to reduce erosion and land degradation.
3) Operational Monitoring System: Local authorities should adopt periodic Landsat-based vegetation monitoring using key indices (NDVI, EVI, SAVI, and PRI) to support early detection of vegetation stress and guide timely interventions.
4) Future Research: Future studies should incorporate multi-temporal analysis, higher-resolution imagery, and field-based validation to better capture seasonal dynamics and improve assessment accuracy.
Abbreviations

NDVI

Normalized Difference Vegetation Index

EVI

Enhanced Vegetation Index

SAVI

Soil-Adjusted Vegetation Index

GI

Green Index

PRI

Photochemical Reflectance Index

NBR

Normalized Burn Ratio

OLI

Operational Land Imager

TIRS

Thermal Infrared Sensor

SVI

Spectral Vegetation Index

USGS

United States Geological Survey

Acknowledgments
The authors would like to express their gratitude to the people of Tullo District, the agricultural development agents, and the local administrators for their kindness and cooperation during the fieldwork. Special thanks to Mekonen Hunde, Head of the Department of Geographic Information, Science for his invaluable support and guidance throughout our study. Finally, the authors are also grateful to the USGS for providing free access to satellite imagery of the study area.
Author Contributions
Samuel Kebere: Conceptualization, Data curation, Formal Analysis, Funding acquisition, Investigation, Methodology, Resources, Software, Visualization, Writing – original draft
Kasegn Fikadu: Methodology, Validation, Visualization, Writing – original draft, Writing – review & editing
Funding
There no one fund rise for this research every think is covered by researcher.
Data Availability Statement
The datasets used and/or analyzed during the current study are available from the corresponding author on reasonable request.
Conflicts of Interest
The authors declare no conflicts of interest.
References
[1] Birajdar, F., & Shaikh, M. (2024). Groundwater exploration and assessment in arid and semi-arid regions of basaltic terrain of Solapur: Lessons learned and future prospects. International Journal of Innovative Science and Research Technology, 9, IJISRT24APR2344.
[2] Change, C. (2016). Agriculture and food security. The State of Food and Agriculture; FAO (Ed.) FAO: Rome, Italy.
[3] Duarte, E., & Hernandez, A. (2024). A review on soil moisture dynamics monitoring in semi-arid ecosystems: methods, techniques, and tools applied at different scales. Applied Sciences, 14(17), 7677.
[4] Duarte-Hernandez, P. R. (2025). Evaluation of Corn Response to Within-Field Nitrogen Management and the Performance of Tools for In-Season Nitrogen Recommendations in Alabama (Master's thesis).
[5] Field, E. H., Milner, K. R., Hatem, A. E., Powers, P. M., Pollitz, F. F., Llenos, A. L.,... & Herrick, J. A. (2024). The USGS 2023 conterminous US time-independent earthquake rupture forecast. Bulletin of the Seismological Society of America, 114(1), 523-571.
[6] Folkmann, E. J., Hughes, M. C., Khan, U. A., & Vaezi, M. (2024). Examining noncommunicable diseases using satellite imagery: a systematic literature review. BMC Public Health, 24(1), 2774.
[7] Gessesse, A. A., & Melesse, A. M. (2019). Temporal relationships between time series CHIRPS-rainfall estimation and eMODIS-NDVI satellite images in Amhara Region, Ethiopia. In Extreme hydrology and climate variability (pp. 81-92). Elsevier.
[8] Key, C. H., & Benson, N. C. (2006). Landscape assessment (LA). In: Lutes, Duncan C.; Keane, Robert E.; Caratti, John F.; Key, Carl H.; Benson, Nathan C.; Sutherland, Steve; Gangi, Larry J. 2006. FIREMON: Fire effects monitoring and inventory system. Gen. Tech. Rep. RMRS-GTR-164-CD. Fort Collins, CO: US Department of Agriculture, Forest Service, Rocky Mountain Research Station. p. LA-1-55, 164.
[9] Li, P., Sheng, M., Yang, D., & Tang, L. (2019). Evaluating flood regulation ecosystem services under climate, vegetation and reservoir influences. Ecological Indicators, 107, 105642.
[10] Ngie, A., & Ahmed, F. (2018). Estimation of Maize grain yield using multispectral satellite data sets (SPOT 5) and the random forest algorithm. South African Journal of Geomatics, 7(1), 11-30.
[11] Shaikh, M., & Birajdar, F. (2024). Advancements in remote sensing and GIS for sustainable groundwater monitoring: applications, challenges, and future directions. International Journal of Research in Engineering, Science and Management, 7(3), 16-24.
[12] Silleos, N. G., Alexandridis, T. K., Gitas, I. Z., & Perakis, K. (2006). Vegetation indices: advances made in biomass estimation and vegetation monitoring in the last 30 years. Geocarto International, 21(4), 21-28.
[13] Xue, J., & Su, B. (2017). Significant remote sensing vegetation indices: A review of developments and applications. Journal of sensors, 2017(1), 1353691.
[14] Zhou, S., Zhang, W., Wang, S., Zhang, B., & Xu, Q. (2021). Spatial–temporal vegetation dynamics and their relationships with climatic, anthropogenic, and hydrological factors in the Amur River basin. Remote Sensing, 13(4), 684.
Cite This Article
  • APA Style

    Kebere, S., Fikadu, K. (2026). Integrating Spectral Vegetation Indices for Monitoring Vegetation Health and Stress in Semi-arid Ethiopia: A Case Study of Tullo District. Science Discovery Plants, 1(1), 50-61. https://doi.org/10.11648/j.sdplants.20260101.16

    Copy | Download

    ACS Style

    Kebere, S.; Fikadu, K. Integrating Spectral Vegetation Indices for Monitoring Vegetation Health and Stress in Semi-arid Ethiopia: A Case Study of Tullo District. Sci. Discov. Plants 2026, 1(1), 50-61. doi: 10.11648/j.sdplants.20260101.16

    Copy | Download

    AMA Style

    Kebere S, Fikadu K. Integrating Spectral Vegetation Indices for Monitoring Vegetation Health and Stress in Semi-arid Ethiopia: A Case Study of Tullo District. Sci Discov Plants. 2026;1(1):50-61. doi: 10.11648/j.sdplants.20260101.16

    Copy | Download

  • @article{10.11648/j.sdplants.20260101.16,
      author = {Samuel Kebere and Kasegn Fikadu},
      title = {Integrating Spectral Vegetation Indices for Monitoring Vegetation Health and Stress in Semi-arid Ethiopia: A Case Study of Tullo District},
      journal = {Science Discovery Plants},
      volume = {1},
      number = {1},
      pages = {50-61},
      doi = {10.11648/j.sdplants.20260101.16},
      url = {https://doi.org/10.11648/j.sdplants.20260101.16},
      eprint = {https://article.sciencepublishinggroup.com/pdf/10.11648.j.sdplants.20260101.16},
      abstract = {This study offers a detailed examination of vegetation health monitoring in the Tullo District of eastern Ethiopia, underscoring the critical role of spatially explicit data in land management within semi-arid environments. Employing a multi-index remote sensing framework with Landsat 9 imagery, the research evaluates vegetation health, stress, and the risk of degradation through the analysis of six distinct spectral indices. The findings reveal considerable spatial variability in vegetation health, pinpointing regions of significant productivity and areas susceptible to degradation. This differential analysis is essential for effective environmental planning and the promotion of sustainable agricultural practices. The study also identifies strong correlations among the spectral indices, bolstering their reliability as tools for assessing vegetation conditions. Furthermore, the integration of these indices provides comprehensive insights, enhancing the understanding of ecological dynamics and informing conservation strategies. The methodology applied in this research is both scalable and cost-effective, thereby facilitating its adoption in broader contexts and regions facing similar challenges. By advancing the methodology for monitoring vegetation health, this work not only contributes to the understanding of vegetation dynamics in Ethiopia but also establishes a valuable framework that can be adapted to analogous ecosystems globally. The implications of this research are far-reaching, supporting informed decision-making in ecological restoration and land-use planning, ultimately fostering enhanced environmental stewardship in semi-arid landscapes.},
     year = {2026}
    }
    

    Copy | Download

  • TY  - JOUR
    T1  - Integrating Spectral Vegetation Indices for Monitoring Vegetation Health and Stress in Semi-arid Ethiopia: A Case Study of Tullo District
    AU  - Samuel Kebere
    AU  - Kasegn Fikadu
    Y1  - 2026/03/16
    PY  - 2026
    N1  - https://doi.org/10.11648/j.sdplants.20260101.16
    DO  - 10.11648/j.sdplants.20260101.16
    T2  - Science Discovery Plants
    JF  - Science Discovery Plants
    JO  - Science Discovery Plants
    SP  - 50
    EP  - 61
    PB  - Science Publishing Group
    UR  - https://doi.org/10.11648/j.sdplants.20260101.16
    AB  - This study offers a detailed examination of vegetation health monitoring in the Tullo District of eastern Ethiopia, underscoring the critical role of spatially explicit data in land management within semi-arid environments. Employing a multi-index remote sensing framework with Landsat 9 imagery, the research evaluates vegetation health, stress, and the risk of degradation through the analysis of six distinct spectral indices. The findings reveal considerable spatial variability in vegetation health, pinpointing regions of significant productivity and areas susceptible to degradation. This differential analysis is essential for effective environmental planning and the promotion of sustainable agricultural practices. The study also identifies strong correlations among the spectral indices, bolstering their reliability as tools for assessing vegetation conditions. Furthermore, the integration of these indices provides comprehensive insights, enhancing the understanding of ecological dynamics and informing conservation strategies. The methodology applied in this research is both scalable and cost-effective, thereby facilitating its adoption in broader contexts and regions facing similar challenges. By advancing the methodology for monitoring vegetation health, this work not only contributes to the understanding of vegetation dynamics in Ethiopia but also establishes a valuable framework that can be adapted to analogous ecosystems globally. The implications of this research are far-reaching, supporting informed decision-making in ecological restoration and land-use planning, ultimately fostering enhanced environmental stewardship in semi-arid landscapes.
    VL  - 1
    IS  - 1
    ER  - 

    Copy | Download

Author Information
  • Department of Geographic Information Science, Oda Bultum University, Chiro, Ethiopia

  • Department of Geographic Information Science, Oda Bultum University, Chiro, Ethiopia